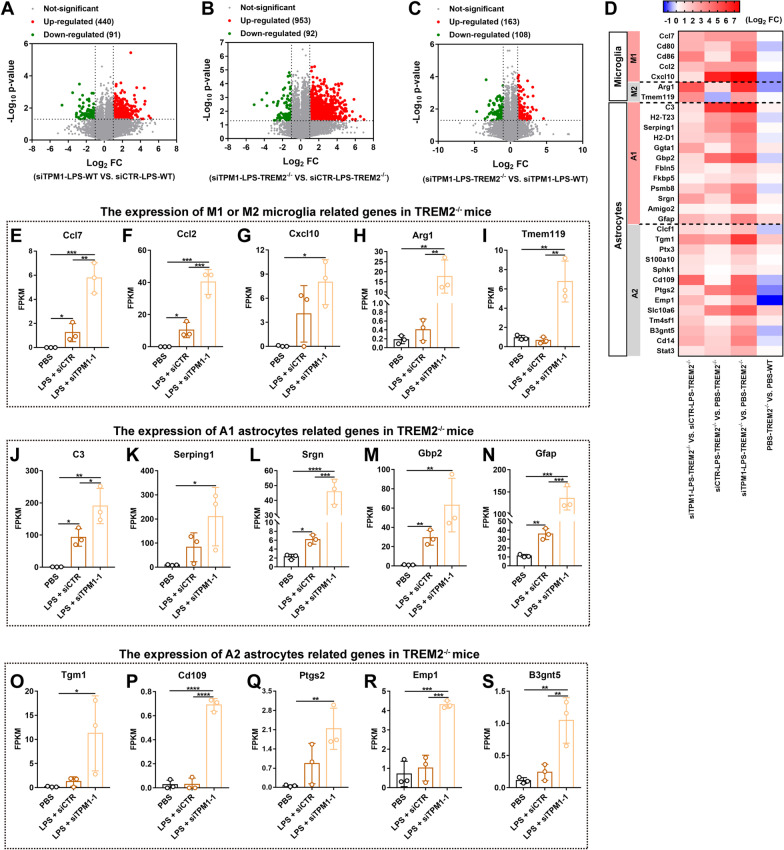
Fig. 4.
TPM1 knockdown changes transcriptome associated with glial cells in the TREM2−/− mouse retina. A–C Volcano plots showing differentially expressed genes (DEGs) in WT or TREM2−/− mice after treatments with LPS and siTPM1-1 or siCTR. Red dots indicate up-regulated genes and green dots show down-regulated genes (n = 3 mice in each group). D A heatmap showing DEGs associated with microglia and astrocytes in TREM2−/− mice following treatments with PBS, or with LPS and siTPM1-1 or siCTR. E–S The expression of DEGs associated with M1 (E–G) or M2 microglia (H, I) and with A1 (J–N) or A2 astrocytes (O–S) in TREM2−/− mice after treatments with LPS and siTPM1-1 or siCTR. Data are presented as mean ± SEM and analyzed by one-way ANOVA with Tukey’s multiple comparison test (compared to PBS or LPS + siCTR, *p < 0.05, **p < 0.01, ***p < 0.001, ****p < 0.001). n = 3 mice in each group. FPKM fragments per kilobase of transcript per million fragments mapped

