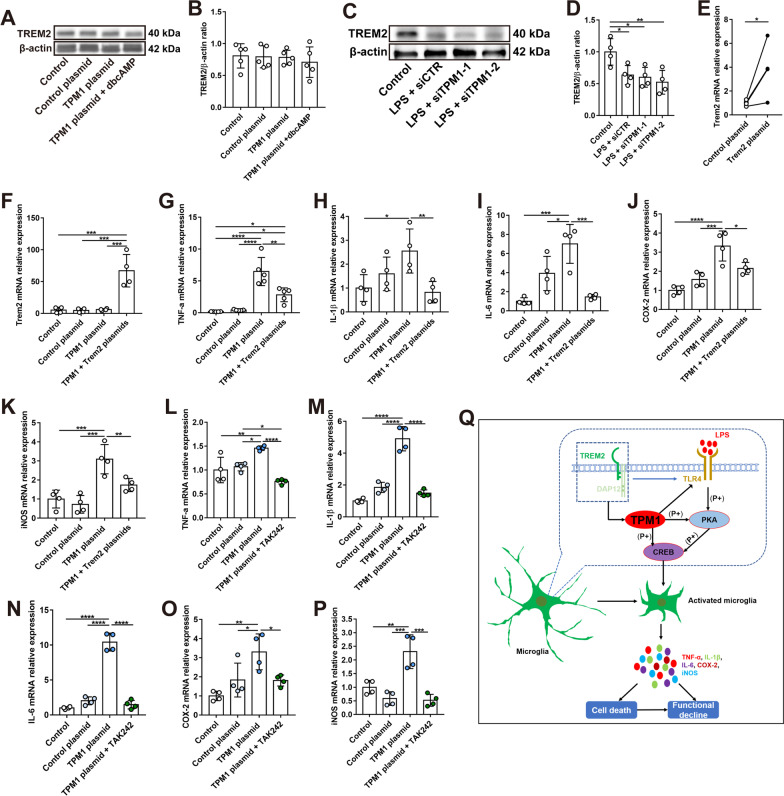
Fig. 8.
TPM1 mediates inflammatory responses downstream of TREM2. A, B Western blot analysis (A) and quantification of TREM2 (B) in BV2 cells after treatments with control plasmid, TPM1 plasmid, or TPM1 plasmid and dbcAMP, a PKA activator. Data are presented as mean ± SEM. C, D Western blot analysis (C) and quantification of TREM2 (D) in BV2 cells following treatments with LPS and siTPM1-1, siTPM1-2 or siCTR. Data are presented as mean ± SEM and analyzed by one-way ANOVA with Tukey’s multiple comparison test (compared to Control, *p < 0.05, **p < 0.01). Four independent experiments were performed. E mRNA level of Trem2 in BV2 cells after transfection with Trem2 plasmid. Data are presented as mean ± SEM, unpaired two-tailed Student’s t test (control plasmid vs. Trem2 plasmid, *p < 0.05). F–K qPCR analysis of Trem2, TNF-α, IL-1β, IL-6, COX-2 and iNOS in BV2 cells following transfection with control plasmid, TPM1 plasmid, or TPM1 and Trem2 plasmids. Data are presented as mean ± SEM and analyzed by one-way ANOVA with Tukey’s multiple comparison test (compared to TPM1 plasmid or TPM1 + Trem2 plasmids, *p < 0.05, **p < 0.01, ***p < 0.001, ****p < 0.001). Four independent experiments were performed. L–P qPCR analysis of TNF-α, IL-1β, IL-6, COX-2, iNOS and Trem2 in BV2 cells after treatments with control plasmid, TPM1 plasmid, or TPM1 plasmid and TAK242, a specific inhibitor of TLR4. Data are presented as mean ± SEM and analyzed by one-way ANOVA with Tukey’s multiple comparison test (compared to TPM1 plasmid or TPM1 plasmid + TAK242, *p < 0.05, **p < 0.01, ***p < 0.001, ****p < 0.001). Four independent experiments were performed. Q Schematic depicting TPM1-regulated pathways in neuroinflammation. TPM1 signals downstream of TREM2 and regulates neuroinflammation and neuronal cell death by mediating the CREB signaling pathways and in a manner of microglia-dependent

