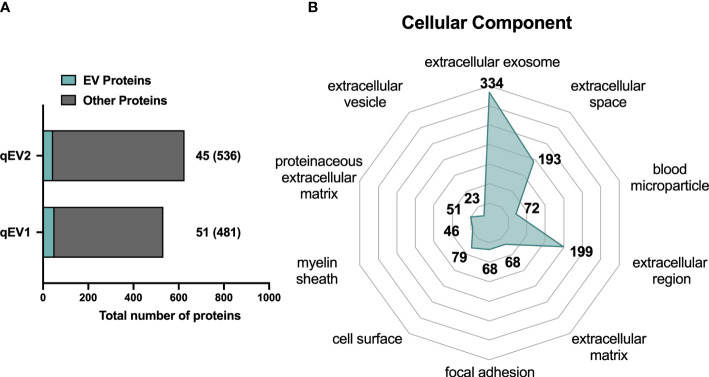
Figure 3.
Proteomic analysis of NOD mouse plasma EVs isolated by qEV. Plasma was collected from non-diabetic NOD mice and EVs were enriched using qEV (pooled fractions 7-10). LC-MS/MS analysis was performed with EVs enriched from 800 μL of pooled plasma from two pre-diabetic NOD mice. The two technical replicates were analyzed and are presented as qEV1 and qEV2. (A) Bars indicate the total number of proteins identified in the technical replicates. Of these the number of proteins found in the Vesiclepedia top 100 EV protein list are depicted in green. Numbers given in brackets indicate the proteins that are not listed among the top 100 EV proteins. (B) The top 10 enriched GO terms for cellular components after GO analysis of all identified proteins. The numbers represent the unique proteins in each term and the enriched GO terms were scored according to a p-value <0.05.

