Figure 3.
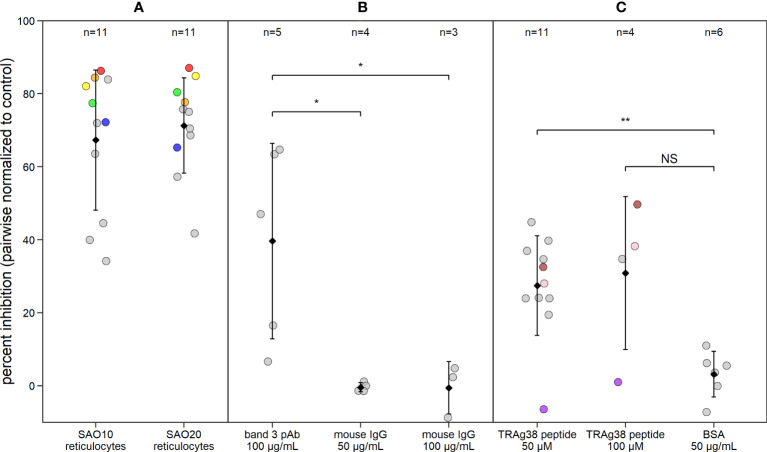
P. vivax reticulocyte invasion efficiency is dependent on band 3 receptor availability. Dot plot showing P. vivax reticulocyte invasion inhibition in invasion assays using (A) two SAO reRBC samples (SAO10 and SAO20), (B) a polyclonal antibody (pAb) against band 3 and (C) a PvTRAg38 peptide (amino acid region 187-208). Percent inhibition for each P. vivax isolate is pairwise-normalized to the invasion observed in the control reRBCs (non-SAO reRBCs, in absence of antibodies or peptides). Dots represent isolates. Black diamonds represent the mean percentage of invasion inhibition, with whiskers showing the standard deviation. Isolates used twice in the presence of different SAO reRBCs or at a different TRAg38 peptide concentration are shown in the same color. Mouse IgG 50 µg/mL and 100 µg/mL = band 3 pAb positive control, BSA = PvTRAg38 peptide positive control. Wilcoxon signed rank test was performed to test for significant differences between the invasion assays and their positive controls. **=p<0.01, *=p<0.05, NS, not significant.

