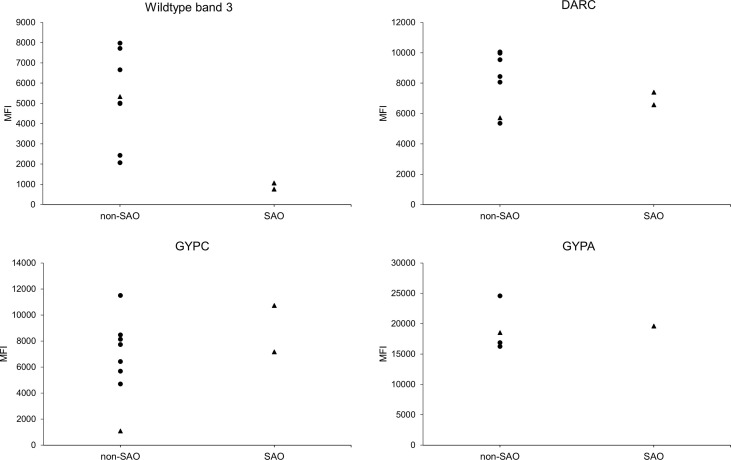
Figure 4.
Receptor expression on SAO and non-SAO reticulocytes as measured by flow cytometry. Surface abundance of band 3, DARC, GYPC, and GYPA receptors on SAO and non-SAO reticulocytes (only CD71+ RBCs were measured) is expressed as median fluorescent intensity (MFI). The SAO reticulocytes used were SAO10 and SAO20, which were also used in the invasion assays (only SAO20 for GYPA). The dots indicate reRBC samples from hemochromatosis blood collected in Belgium, and triangles reRBC samples from cord blood collected in Papua New Guinea. reRBCs were incubated with commercial fluorescently tagged antibodies, using primary (band 3, GYPC, GYPA) or secondary (DARC) binding. The anti-band 3 antibody used was reported to specifically target wildtype band 3 (Groves et al., 1993). The non-SAO reRBC sample from Papua New Guinea (triangle) has a homozygous GYPC exon 3 deletion, resulting in a low MFI for GYPC compared with the other reRBC samples. No statistical tests could be performed due to the small number of SAO reRBCs.

