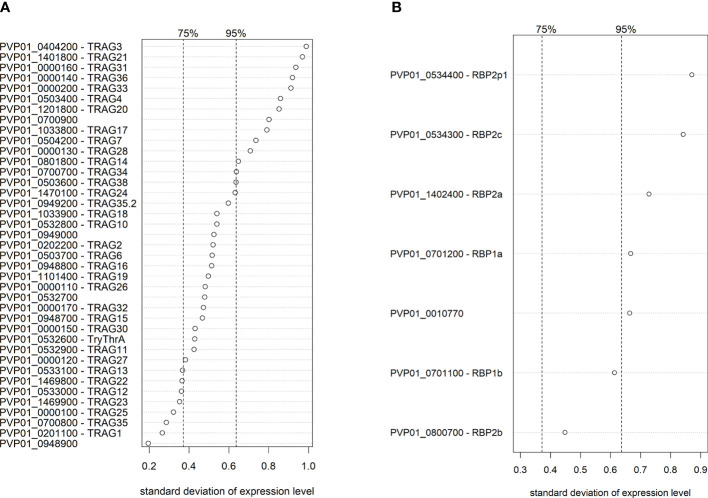
Figure 6.
Ranking of transcriptional variation (standard deviation) of the PvTRAg (A) and PvRBP (B) family members in Peruvian schizont isolates (n=10). Dashed lines indicate the 75% and 95% quantile, indicating that on the right of these lines are respectively the 25% and 5% most variable genes of the genome. Expression levels were normalized and made homoscedastic, after which standard deviation was calculated per gene and used as a measure of variability. The PvTRAg gene PVP01_0000210 was excluded from the analysis due to <5 normalized transcript counts.

