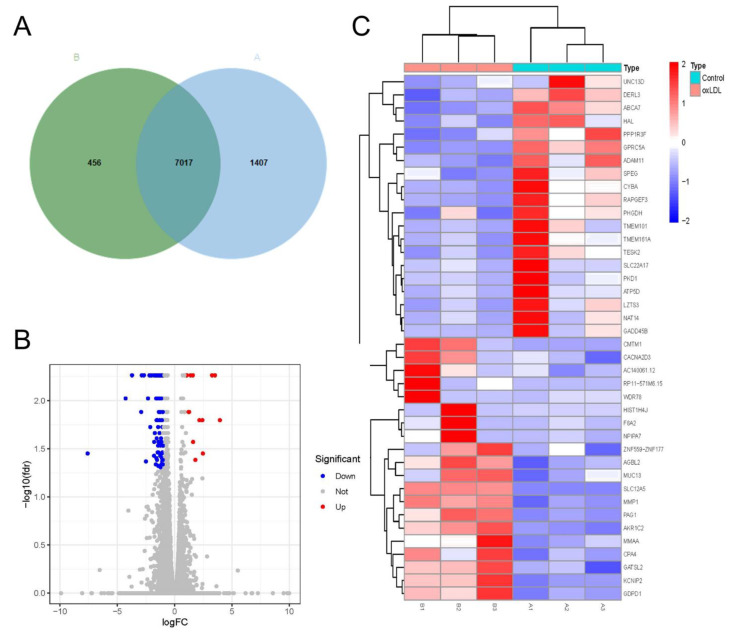
Figure 4.
Characteristics of mRNA expression profiles in proliferation and migration models of HCASMCs: (A) The number of coding genes in the proliferation and migration models of HCASMCs and the control group. (B) The volcano plots of the differentially expressed genes. (C) The heatmap of the top 20 highly expressed genes and top 20 lowly expressed genes.

