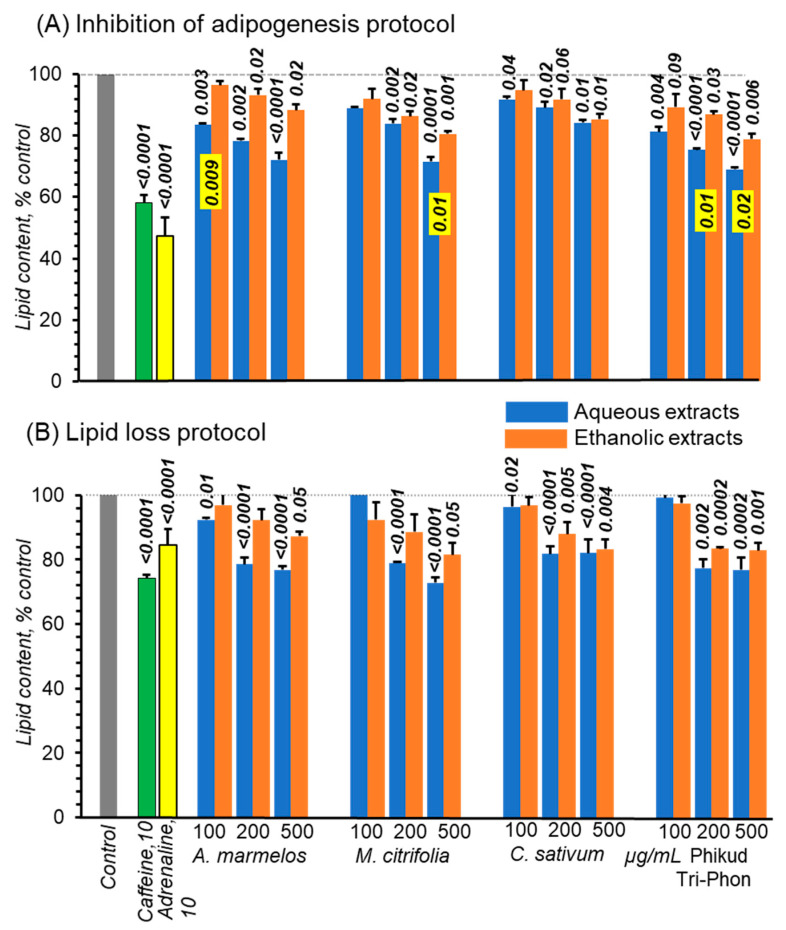
Figure 3.
Lipid accumulation in 3T3-L1 cells after 7 days of adipogenesis. In (A), the cells were also treated with, either one of four aqueous extracts at 100–500 ug/mL of extract indicated (Blue bars) or ethanolic extracts from the same preparations (Orange bars). For (B), the protocol was identical except the same series of extracts were only present for day 7 and that represents loss of accumulated triglycerides. All concentrations are µg/mL, error bars are means ± SD, n = 3 and p-values comparing control by one-way ANOVA, p-values in yellow boxes compare differences between aqueous and ethanolic extracts by 2-tailed Student’s t-test.

