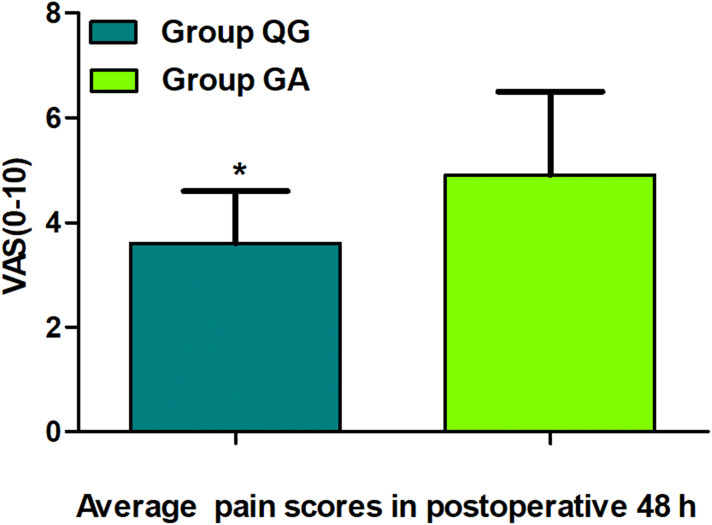
Figure 3.
Comparison of the average pain scores in 48 h postoperatively between groups. The data are given as mean ± SD, compared with Group GA, *P<0.01. Data were compared by independent-sample t-test. Group QG, quadratus lumborum block combined with general anaesthesia, Group GA, general anaesthesia alone, VAS, visual analogue scale.

