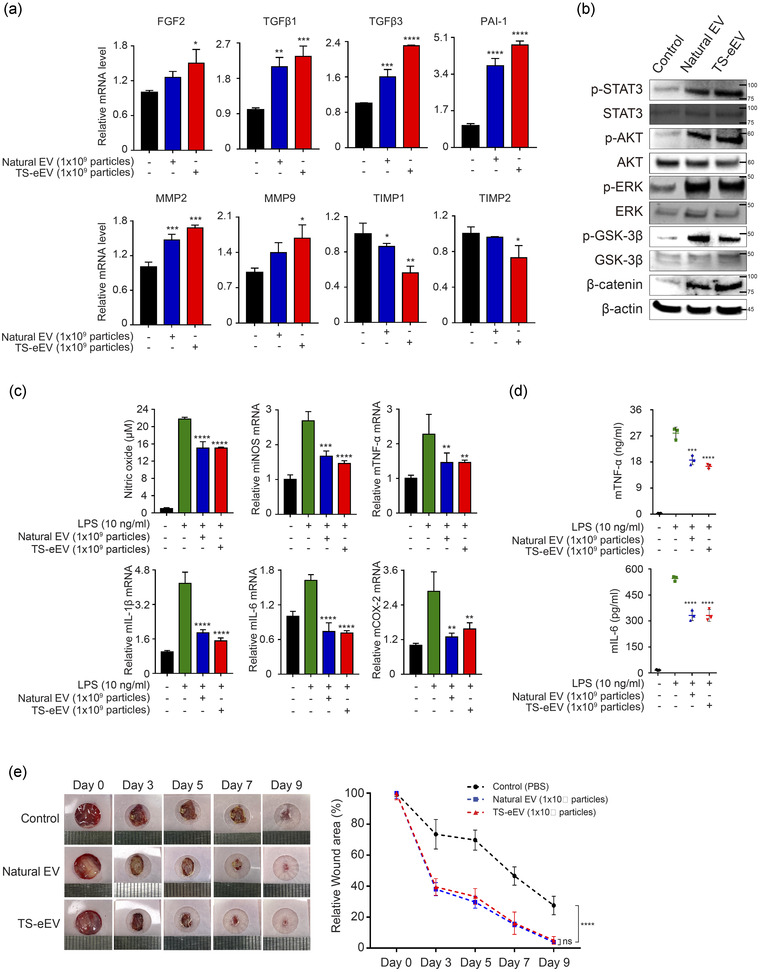
FIGURE 4.

The therapeutic effects of natural EVs and TS‐eEVs on wound healing and inflammation. (a) The expression levels of genes related to wound healing were measured using qRT‐PCR. Expression levels of growth factors (FGF2, TGFβ1, TGFβ3) and genes related to cell migration ability (PAI‐1, MMP2, MMP9) were significantly increased in the EV‐treated group compared to those in the PBS control group. The expression of genes inhibiting migration ability (TIMP1 and TIMP2) decreased in the EV‐treated group. Experiments were performed in triplicate, and the results were normalized using GAPDH expression. FGF2, fibroblast growth factor 2; TGFβ1, transforming growth factor beta 1; TGFβ3, transforming growth factor beta 3; PAI‐1, plasminogen activator inhibitor‐1; MMP2, matrix metalloproteinase 2; MMP9, matrix metalloproteinase 9; TIMP1, TIMP metalloproteinase inhibitor 1; TIMP2, TIMP metalloproteinase inhibitor 2; GAPDH, glyceraldehyde 3‐phosphate dehydrogenase. Statistical significance was analysed using one‐way ANOVA. (*p ≤ 0.05, **p ≤ 0.01, ***p ≤ 0.001, ****p ≤ 0.0001). (b) Western blot was used to determine the expression levels of STAT3, AKT, ERK, GSK‐3β, and β‐catenin proteins that play important roles in cell growth during wound healing in NHDF‐treated groups with PBS or EVs. It was established that the phosphorylated forms of STAT3, AKT, ERK, GSK‐3β were increased in the EV‐treated group compared to that in the control group. (c) An assessment of anti‐inflammatory potential of natural EVs and TS‐eEVs in RAW264.7 cells treated with PBS and LPS (10 ng/ml) for 18 h. NO content in the supernatant was measured. The relative mRNA levels of pro‐inflammatory genes including iNOS, TNF‐α, IL‐1β, IL‐6, and COX‐2 were determined using RT‐PCR; data were normalized with respect to GAPDH and were expressed as a fold change compared to untreated RAW264.7 cells (control). (n.s.: p > 0.05, *p ≤ 0.05, **p ≤ 0.01, ***p ≤ 0.001, and ****p ≤ 0.0001). (d) ELISA data of pro‐inflammatory cytokine (TNF‐α and IL‐6) secreted by LPS‐induced RAW264.7 cells treated with PBS or EVs. (***p ≤ 0.001, ****p ≤ 0.0001). (e) Representative images of in vivo wound closure in BALB/c nude mice treated with PBS, Natural EVs, or TS‐eEVs, on days 0, 3, 5, 7, and 9. Graph representing the quantitative analysis of relative wound area after treatment with natural EVs and TS‐eEVs. Statistical significance was determined using RMANOVA with post hoc analysis. (n.s.: p > 0.05, ****p ≤ 0.0001)
