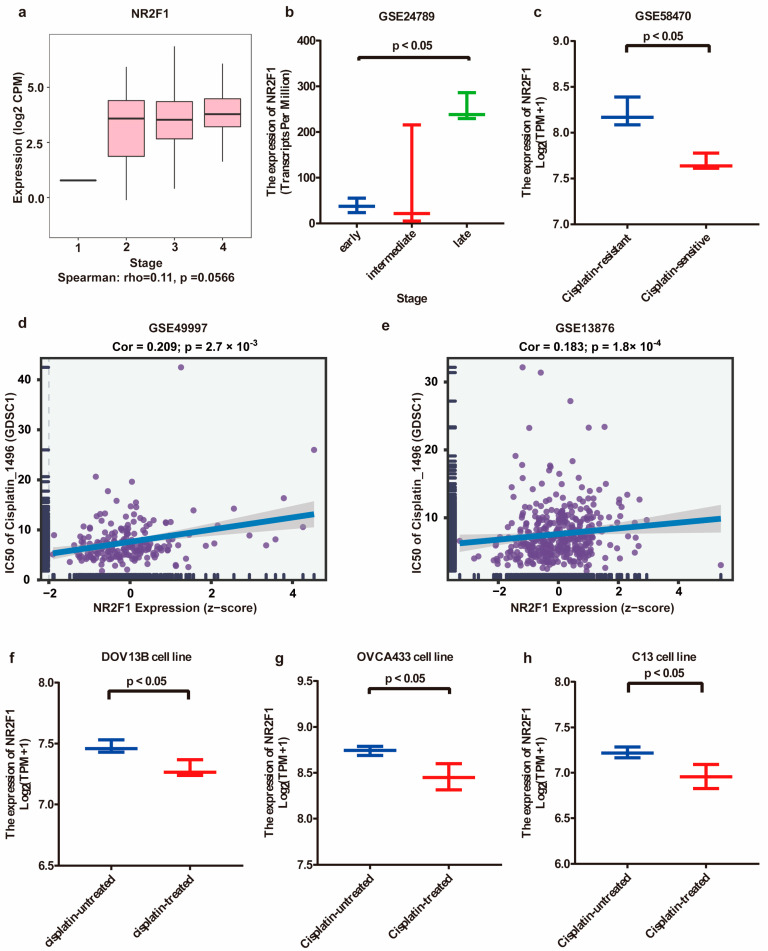
Figure 3.
The association of NR2F1 with OC progression and cellular response to platinum treatment. (a) NR2F1 expression tendency in OC tissues at different clinical stages by TISIDB. (b) NR2F1 expression tendency in mouse ovarian surface epithelial (MOSE) cells at different stages based on GSE24789. (c) Confirmation of the elevated NR2F1 expr-ession in cisplatin-resistant OC cell lines using GSE58470. (d,e) Scatter plots of the association between NR2F1 expression and IC50 values of cisplatin in GSE49997 and GSE13876 datasets. (f–h) Changes in NR2F1 expression levels in OC DOV13B, OVCA433 and C13 cell lines following cisplatin treatment.

