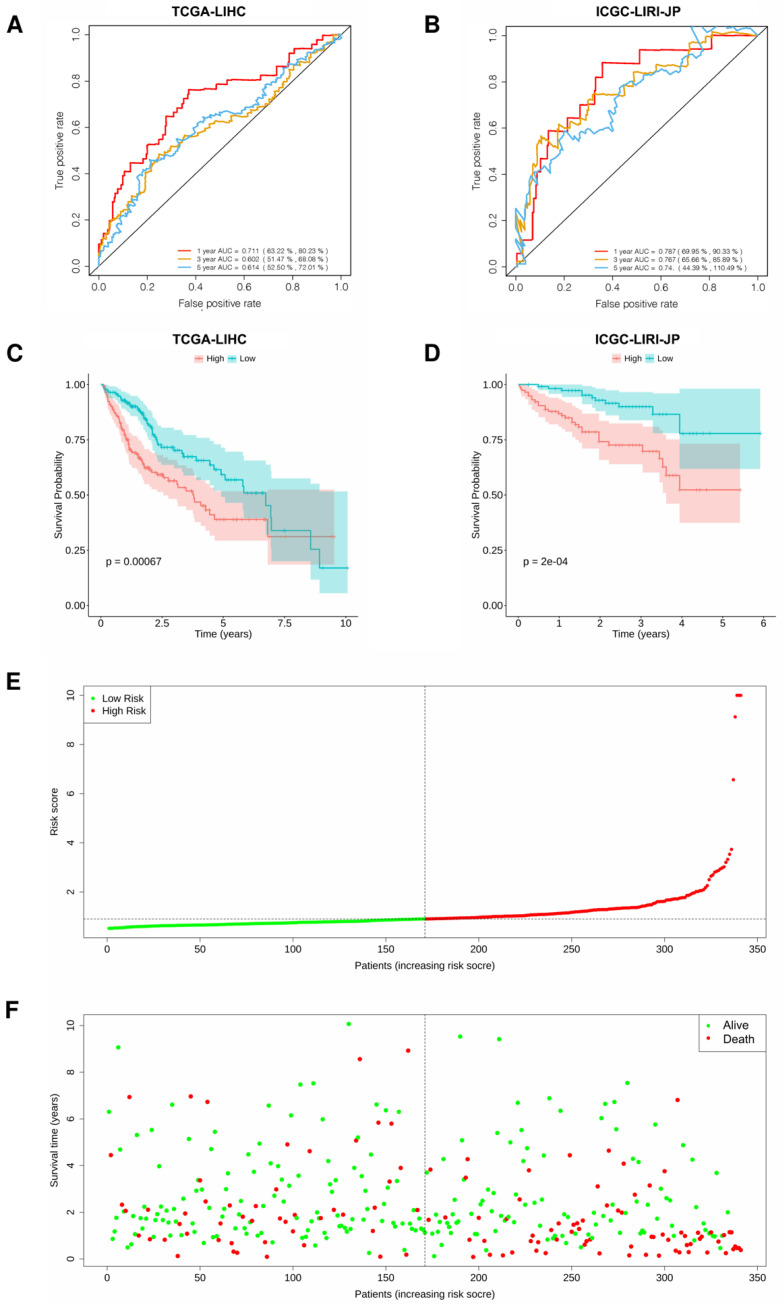
Figure 5.
Validation of the three-gene signature in HCC. (A,B) Time-dependent ROC curves of the three-gene signature in two datasets. (C,D) Kaplan-Meier curves of risk subgroups in the two datasets. (E,F) The association between survival status and RS. Integration nomogram based on risk score and cancer status for HCC prediction.

