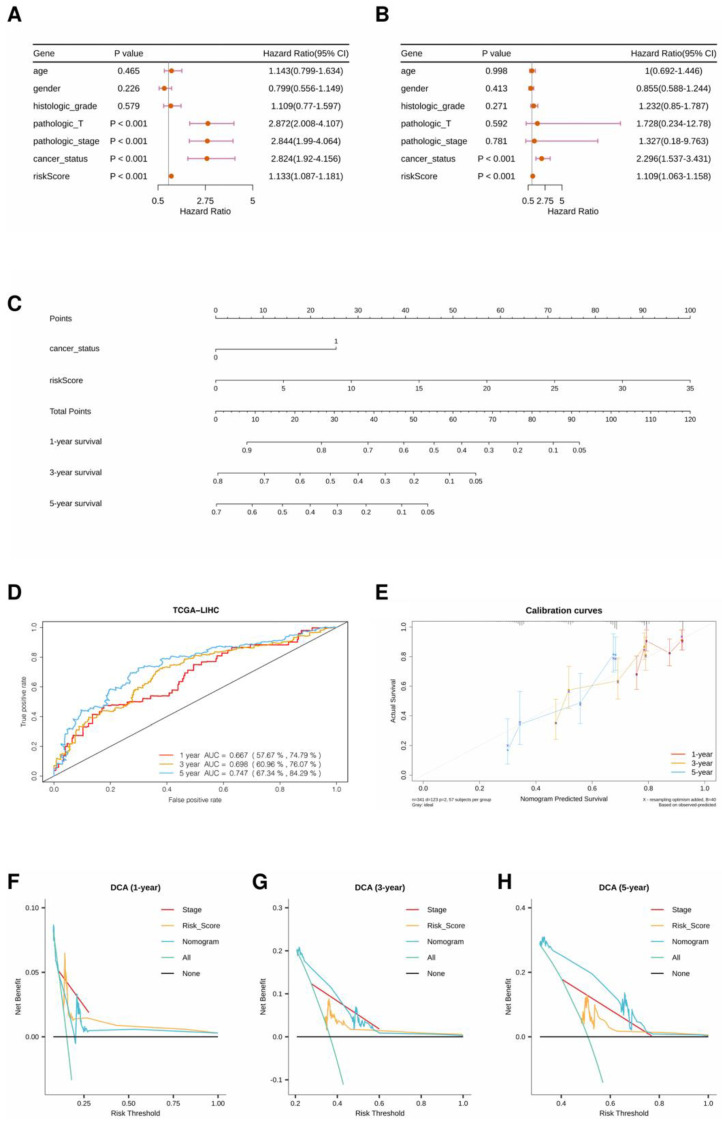
Figure 6.
(A) Forest plot of univariate regression analysis. (B) Forest plot of multivariate regression analysis. (C) A nomogram incorporating cancer status and risk score for prognosis. (D) ROC curves of the nomogram with AUCs of 0.667, 0.698, and 0.747 at 1, 3, and 5 years, respectively. (E) Comparison of predicted and actual OS in the calibration curve. (F–H) Decision curve analyses of models in the TCGA-LIHC dataset.

