
Fig. 1.
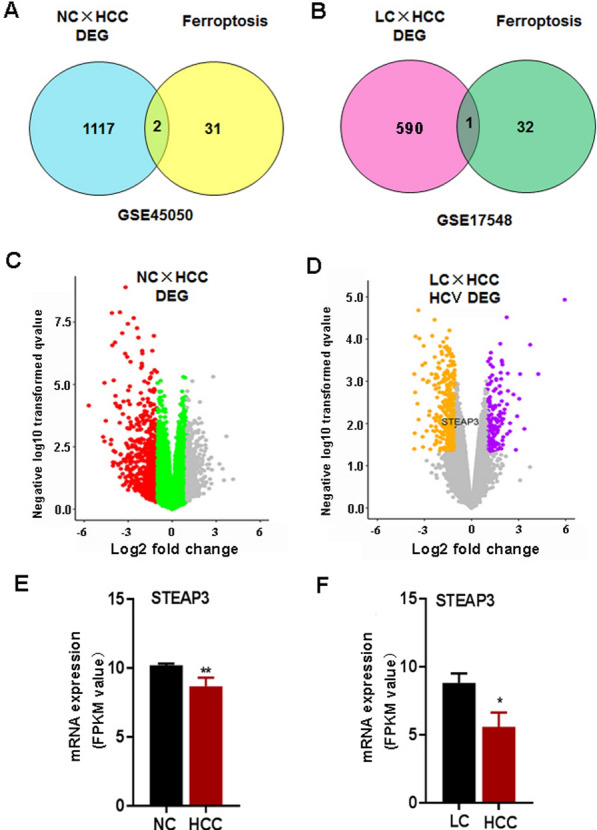
Expression profile of ferroptosis-related DEGs in normal liver tissue vs. HCC and HCV- induced cirrhosis vs. HCC from GEO datasets. A, B The venn diagrams of the expression of differential gene STEAP3 in normal liver tissue, cirrhosis and HCC tissues. C, D. The volcano diagrams of the expression of differential gene STEAP3 in normal liver tissue, cirrhosis and HCC tissues. E The RT-PCR results showing the expression level of STEAP3 in normal liver tissues and HCC tissues. F The RT-PCR results showing the expression level of STEAP3 in HCV-induced cirrhosis and HCC tissues