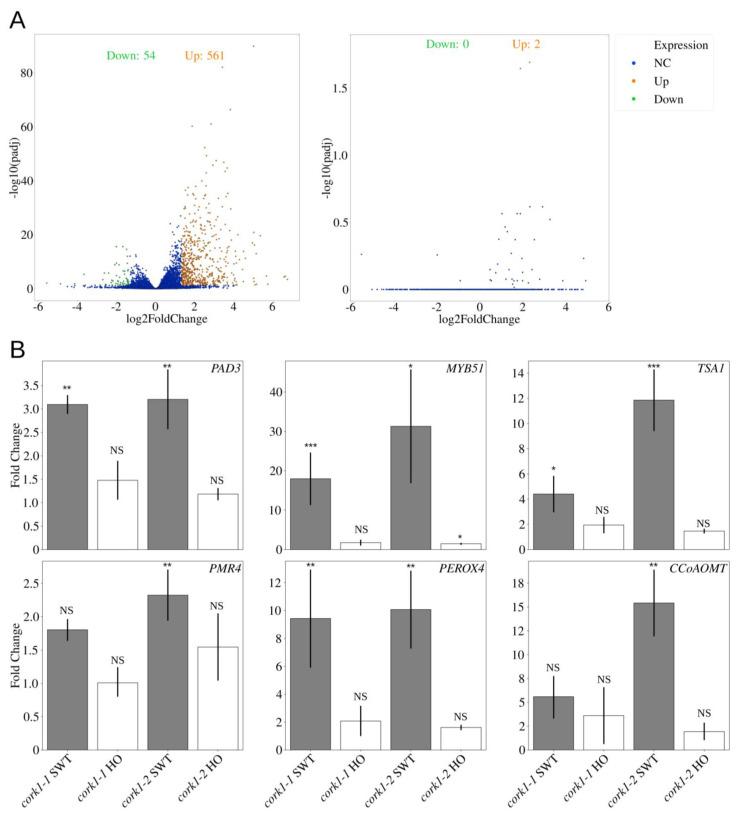
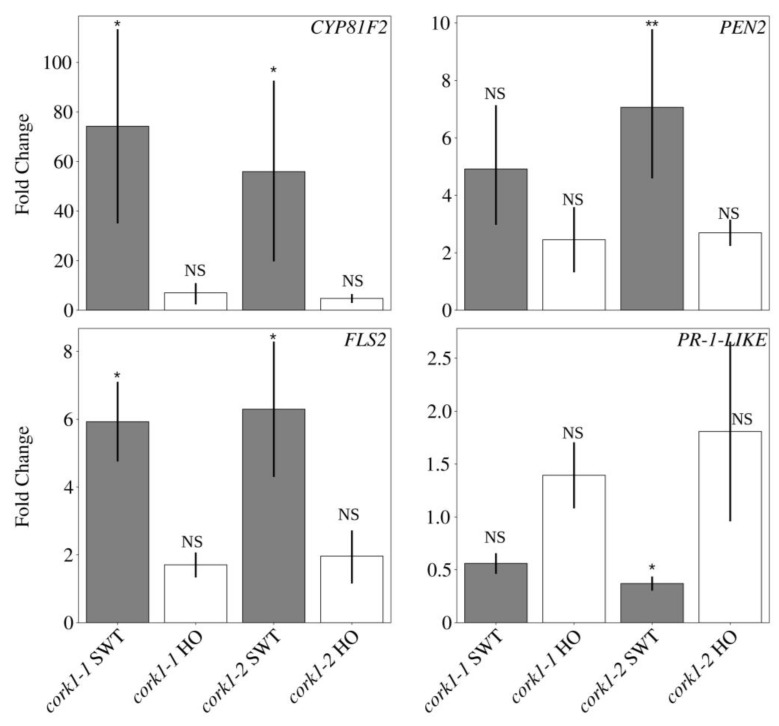
Figure 7.
CT-regulated genes. (A) Volcano plots showing the distribution of differentially expressed genes in root tissue. Left: 10 µM CT treatment compared to water control in SWT. Right: 10 µM CT treatment compared to water control in HO. NC: no change; Up: upregulation; Down: downregulation; padj: adjusted p-value using Benjamini and Hochberg method. The FDR cutoff value is set as 0.1. (B) qPCR analysis of candidate genes regulated by 10 µM CT in root tissue of cork1-2 SWT and HO seedlings. Values were normalized to water treatment on the same genotype. SWT/HO: segregated wild-type/homozygous mutant from the cross to aequorin wild-type. Error bars represent SE from 4 independent biological replicates, each with 16 seedlings. Statistical significance was determined by Student’s T-test based on ΔCq values (NS: not significant; * p ≤ 0.05; ** p ≤ 0.01; *** p ≤ 0.001).


