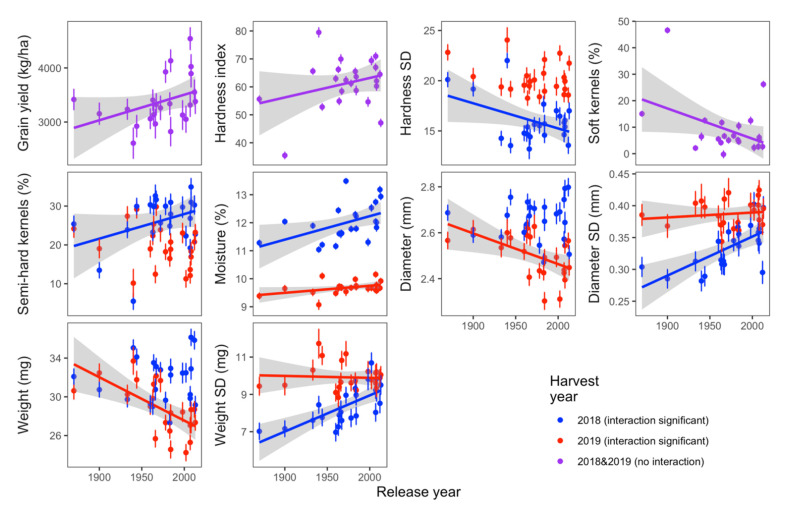
Figure 2.
Kernel characteristics and grain yield with significant trends across release year. For variables with a significant release year × harvest year interaction, least squares means are plotted by harvest year. For variables where only the main effect of release year was significant, least squares means are plotted across both harvest years. Regression lines are plotted only for data with a significant trend across release year. The gray shaded area shows the 95% confidence interval of the regression line.

