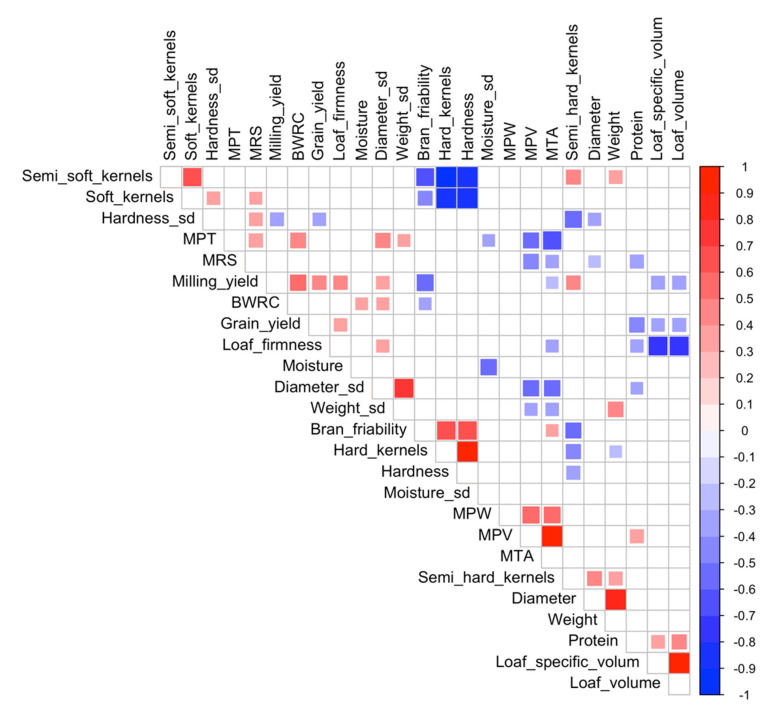
Figure 5.
Partial correlation between each variable. Partial variable was harvest year, and plant height. Least-squares means in each harvest year were used in the correlation (n = 46). Only significant correlations are plotted (p < 0.05). (MPW: Midline peak width; MPV: Midline peak value; MTA: Midline time max area; MPT: Midline peak time; MRS: Midline right slope; BWRC: Bran water retention capacity).

