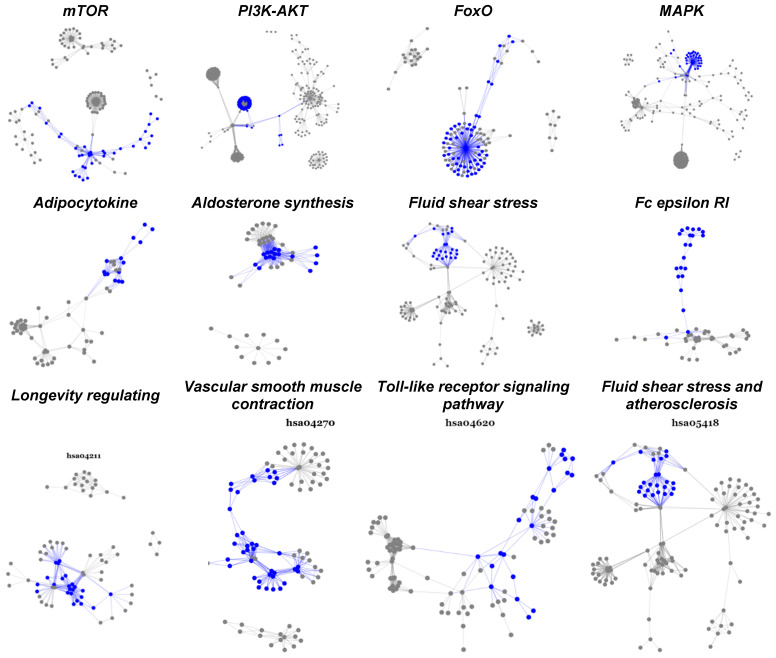
Figure 3.
Statistically significant and biologically active subpathways in TNBC chemoresistance. This figure displays twelve significantly activated pathways overlapped between paired and unpaired cohorts. The highlighted parts (blue) are subpathways upregulated as the breast tumor developed from pre- to post-chemotherapy.

