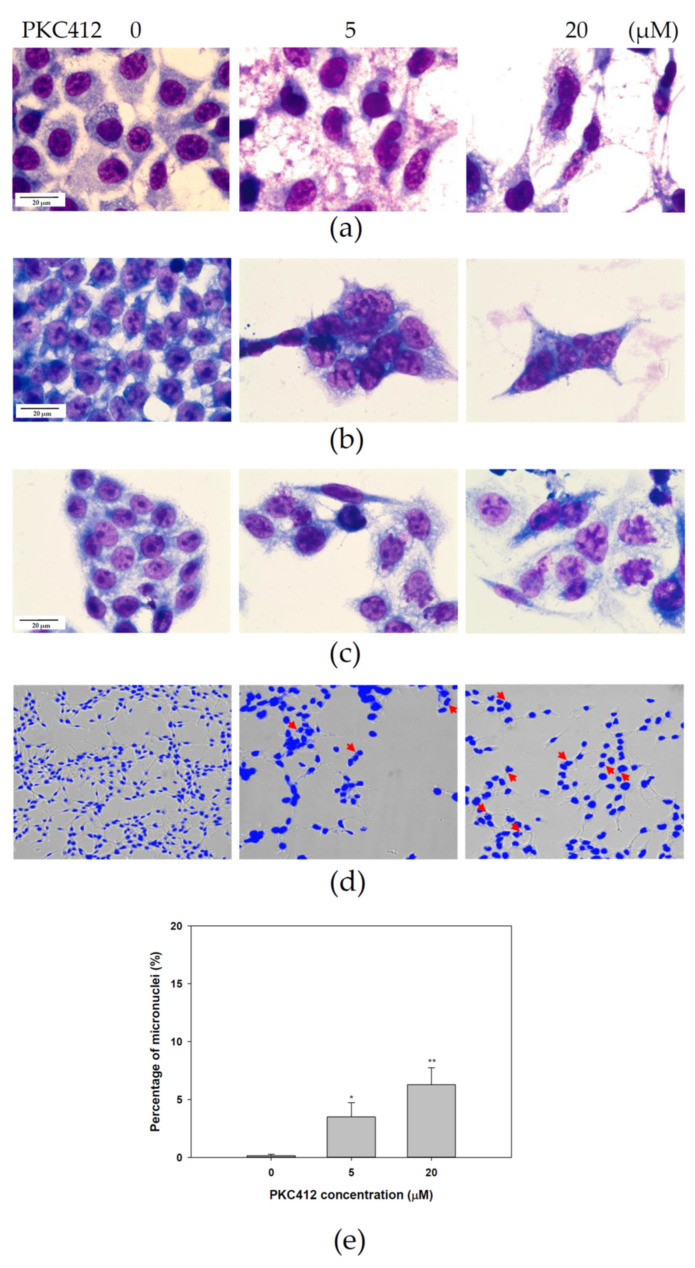
Figure 3.
Morphology examination of colorectal carcinoma cells treated with midostaurin (PKC412). After treatment, morphologies were stained with Liu’s stain and photographed under light microscopy in 1000-fold magnification. The representative morphology of CT26 (a), HCT116 (b), and SW480 (c) cells was shown after staining. For micronucleic detection, CT26 cells were washed with PBS and fixed in 4% paraformaldehyde. The slides were subsequently stained with 1 μg/mL of DAPI for 10 min. The morphology and fluorescence expression were visualized and photographed under ImageXpress® Micro 4 microscope in 200-fold magnification (d). Arrow (red) indicates the micronucleic formation. The proportion of micronucleic induced by PKC412 was counted (e). Data from three separate experiments were expressed as mean ± SEM. Significant differences between control cells and cells treated with PKC412 are indicated by * p < 0.05 and ** p < 0.01.

