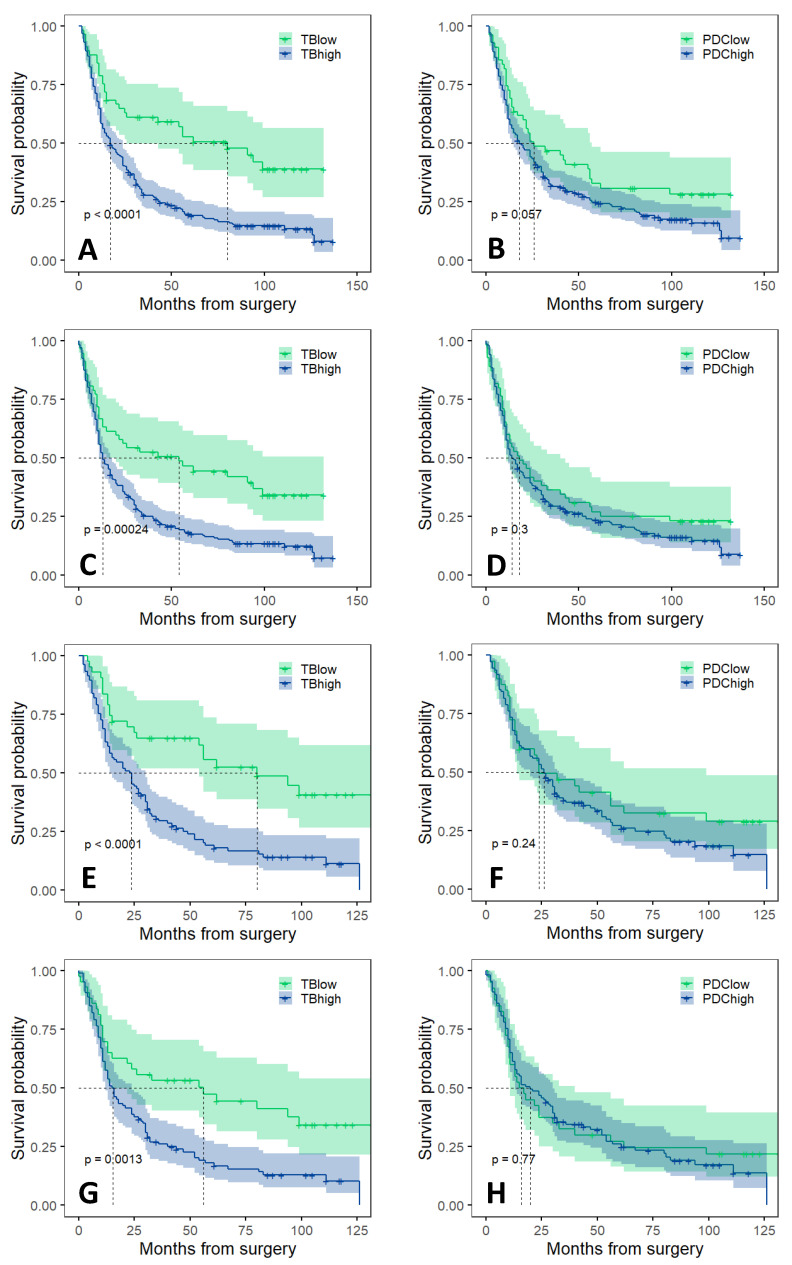
Figure 2.
Kaplan–Meier curves of OS and DFS survival analyses. (A) OS by TB low and TB high groups in the total cohort, (B) OS by PDC low and PDC high groups in the total cohort, (C) DFS by TB low and TB high groups in the total cohort, (D) DFS by PDC low and PDC high groups in the total cohort, (E) OS by TB low and TB high groups in the intestinal type adenocarcinomas, (F) OS by PDC low and PDC high groups in the intestinal type adenocarcinomas, (G) DFS by TB low and TB high groups in the intestinal type adenocarcinomas, (H) DFS by PDC low and PDC high groups in the intestinal type adenocarcinomas. OS: overall survival, DFS: disease free survival, TB: tumor budding, PDC: poorly differentiated cluster.

