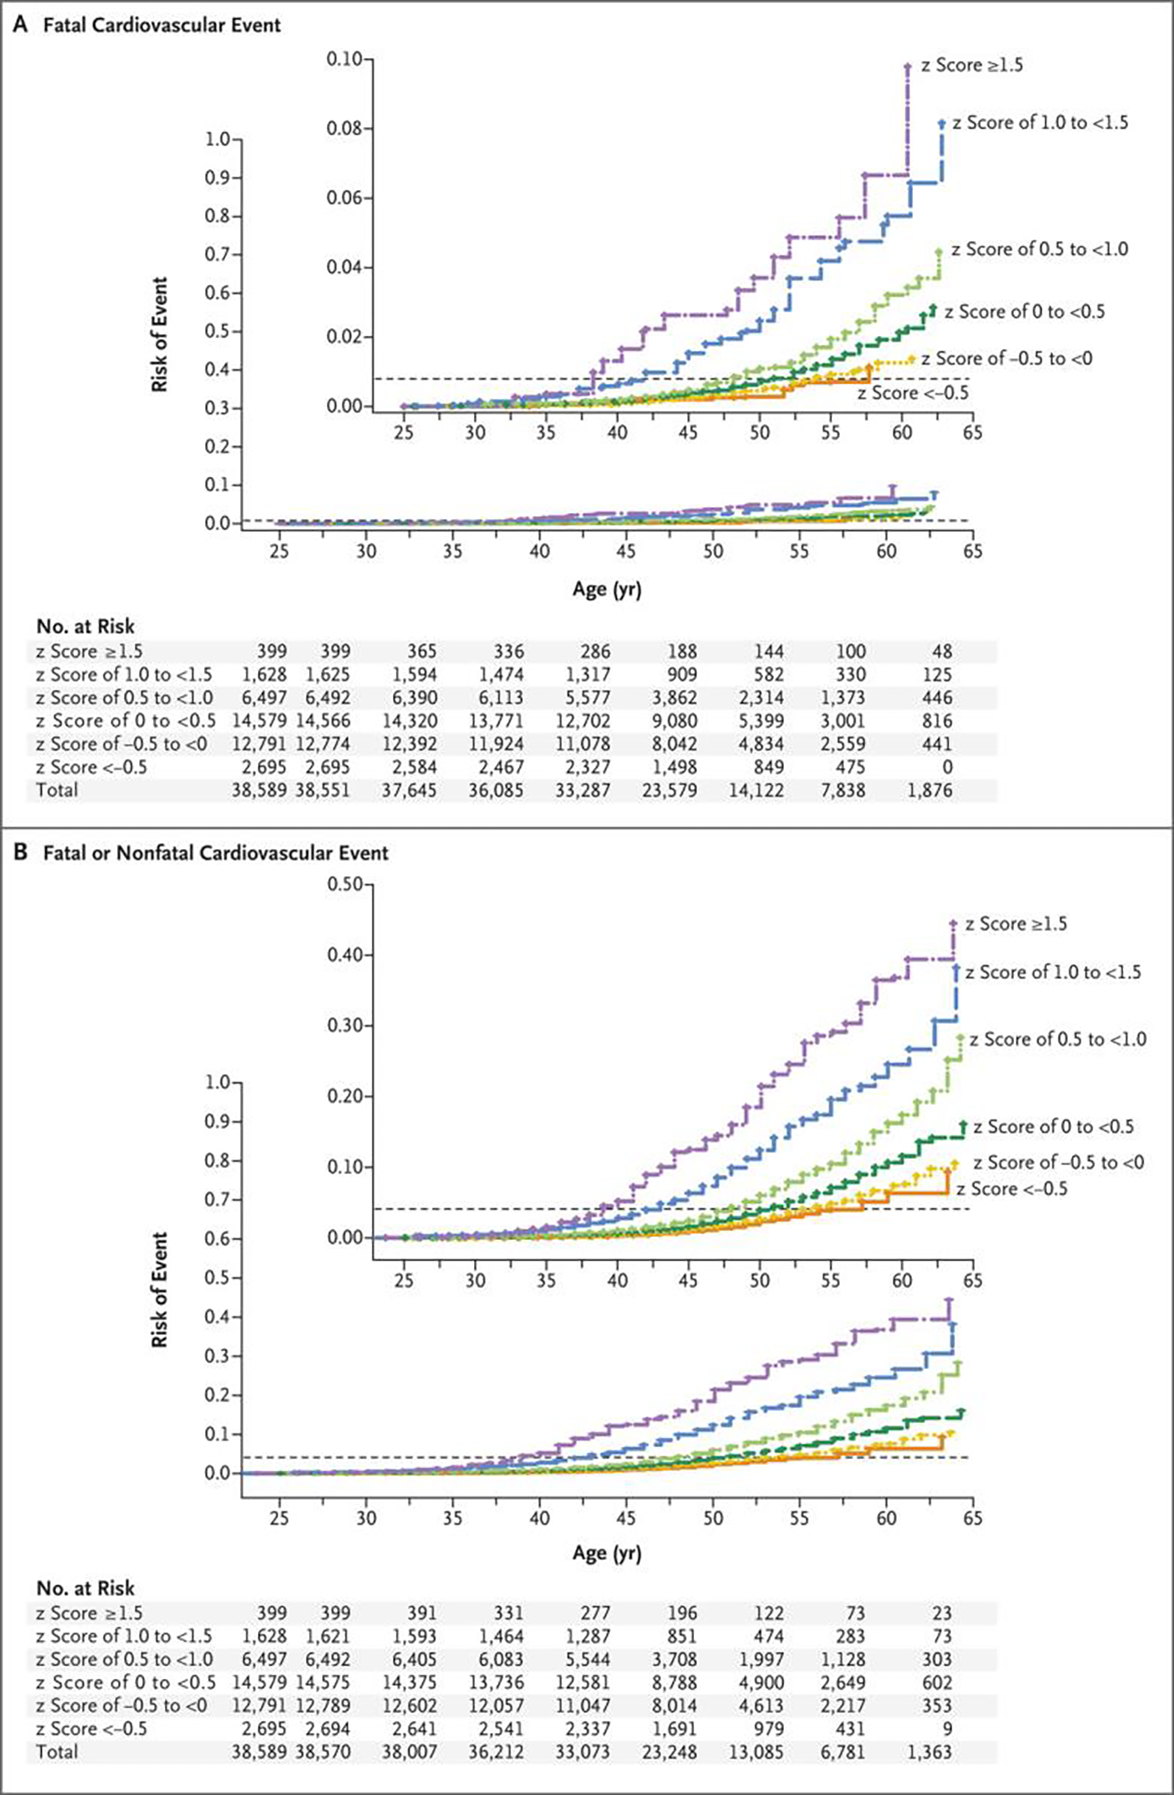
Figure 2. (facing page). Cumulative Risk of Cardiovascular Events According to Categories of the Combined-Risk z Score and Age.

The cumulative risk of cardiovascular events is shown as the estimated probability according to the combined-risk z score and age (Kaplan–Meier method). The horizontal dashed line in each panel indicates the overall risk of the event. Panel A shows the hazard ratios for fatal cardiovascular events, and Panel B the hazard ratios for fatal or nonfatal cardiovascular events. All participants were included in these analyses; there were 319 fatal events and a mean of 1563 fatal or nonfatal events across imputations. In each panel, the inset shows the same data on an enlarged y axis. The columns of tabular data below the graphs correspond to the following ages (in years): 25.0, 27.5, 32.5, 37.5, 42.5, 47.5, 52.5, 57.5, and 62.5.
