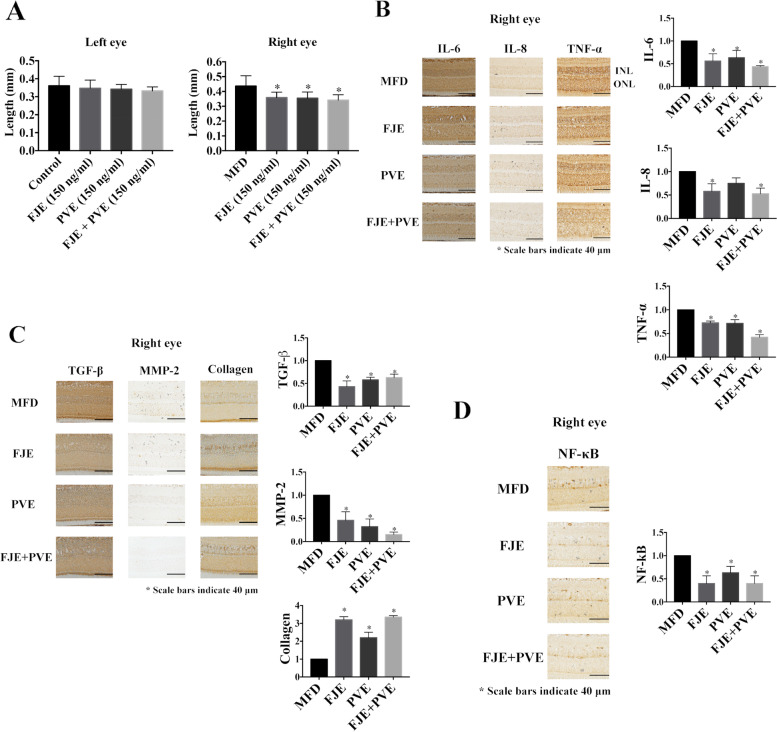
Fig. 6.
Effect of FJE and PVE on myopia progression and expression levels of inflammation-related proteins in MFD mice. A The axial length was determined as the change in axial length measurements before and after MFD for 12 days (n = 10 per group). The ANOVA test was used to determine significant differences, and comparisons between control, FJE (150 ng/ml), PVE (150 ng/ml), and FJE + PVE (150 ng/ml). B Immunohistochemical analysis of IL-6, IL-8, and TNF-α expression in MFD (Right eye MFD), FJE (150 ng/ml)-treated MFD eyes (Right eye), PVE (150 ng/ml)-treated MFD eyes (Right eye), and FJE + PVE (150 ng/ml)-treated MFD eyes (Right eye). INL: inner nuclear layer; ONL: outer nuclear layer. Quantification of IL-6, IL-8, and TNF-α accumulation in retinas of the right eye using Image J software. C Immunohistochemical analysis of TGF-β1, MMP-2, and type I collagen expression in MFD (Right eye control), FJE (150 ng/ml)-treated MFD eyes (Right eye), PVE (150 ng/ml)-treated MFD eyes (Right eye), and FJE + PVE (150 ng/ml)-treated MFD eyes (Right eye). Quantification of TGF-β1, MMP-2, and type I collagen of accumulation in the retinas of the right eye using Image J software. D Immunohistochemical analysis of NF-κB expression in MFD (Right eye control), FJE (150 ng/ml)-treated MFD eyes (Right eye), PVE (150 ng/ml)-treated MFD eyes (Right eye), and FJE + PVE (150 ng/ml)-treated MFD eyes (Right eye). Quantification of NF-κB of accumulation in the retinas of the right eye using Image J software. The ANOVA test was used to determine significant differences, and comparisons between control, FJE (150 ng/ml), PVE (150 ng/ml), and FJE + PVE (150 ng/ml). Original IHC are presented in Supplementary Fig. S3. The IHC data are expressed as the mean ± SD of three independent experiments. * p < 0.05 compared to the control

