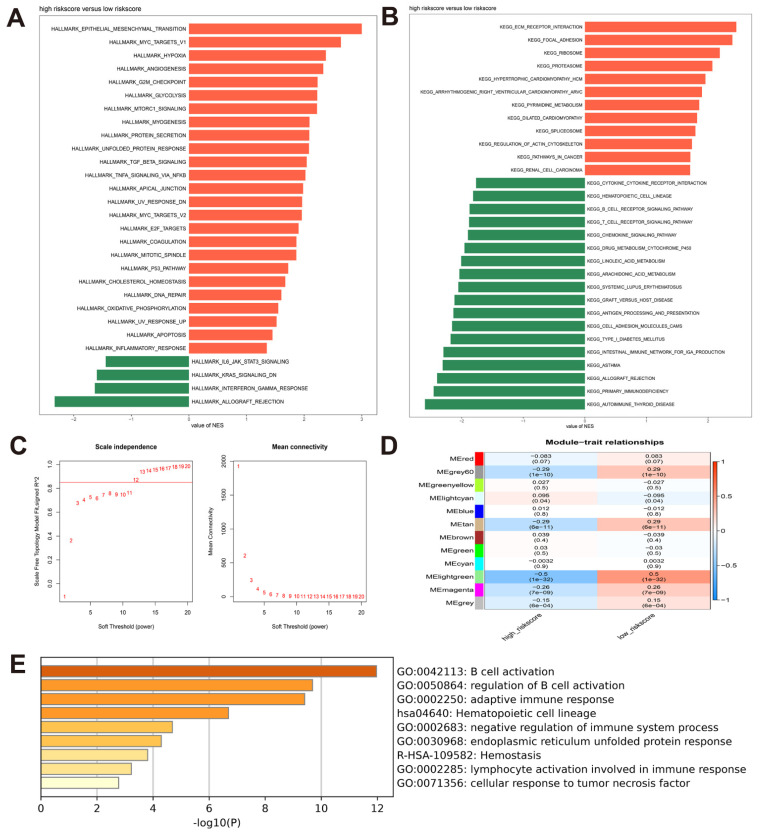
Figure 4.
Identification of the risk model-associated enriched biological functions and pathways. (A) GSEA analysis of the enriched hallmark gene sets in the high-risk group; (B) GSEA analysis of the enriched KEGG gene sets in the high-risk group; (C) analysis of scale-free gene network topology and mean connectivity of various soft-threshold powers in TCGA-HNSCC cohort; (D) the correlation coefficients and p-values of module-risk relationships for TCGA-HNSCC cohort; (E) functional annotation of genes within the light green module.

