letter
. 2022 Oct 5;119(4):635–637. [Article in Portuguese] doi: 10.36660/abc.20220143

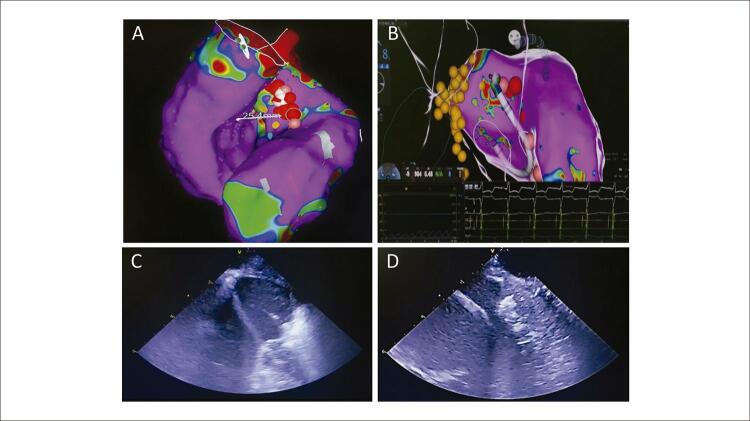
Figure 1. Carto 3-guided electroanatomic maps of the right and left ventricle. This picture shows the point with the largest septal thickness (25 mm). The points in red represent the region where the radiofrequency was applied. B) Beginning of the application of radiofrequency. The yellow points represent the areas to be avoided in which the conduction system was identified. C) Hyperechogenicity of the septal region, evaluated continually using the intracardiac echocardiogram during the application of radiofrequency. It is possible to identify the catheter in the strap resting on the septal region. D) At the end of the procedure, an intense edema is observed in the septal region, associated with hyperechogenicity near the left ventricle outflow tract.

Figure 1