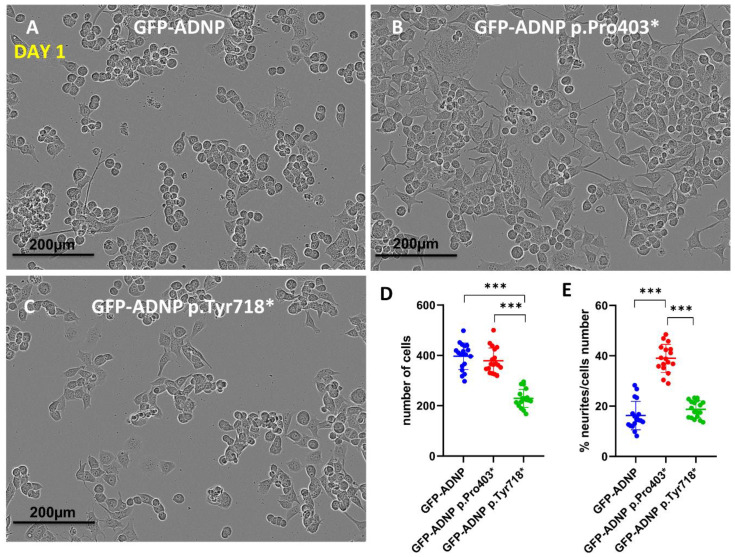
Figure 2.
IncoCyte images and analysis indicate differential effects of selected ADNP mutants. (A) Neuroblastoma cell lines expressing full-length ADNP or (B,C) truncated ADNP proteins were scanned with IncoCyte (×20) following a 24 h incubation in differentiation medium. Image size (1408 × 1040 pixels), represents one field, with 20 fields being analyzed for each condition. (D) When the number of counted cells per field (N = 20) was analyzed statistically, significant cell death in the GFP-ADNP p.Tyr718*-expressing line was revealed, *** p < 0.001. (E) Calculating the percentage of neurites in each field showed increased neurite levels in cells expressing GFP-ADNP p.Pro403*.

