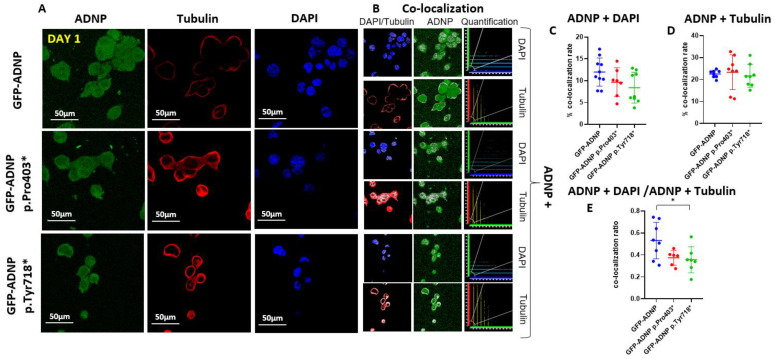
Figure 3.
Immunostaining of tubulin and staining with DAPI after 24 h in culture revealed a minor effect of mutant protein expression. (A) Neuroblastoma cell lines expressing full-length ADNP or truncated ADNP proteins conjugated to GFP (green) were immunostained with monoclonal anti-tubulin (red) antibodies (TUB2.1), while cell nuclei were stained/visualized with DAPI (DNA, blue). (B) Nuclear or cytoplasmic co-localization of the DAPI and ADNP or tubulin and ADNP, respectively, is represented by the white color (apparent dots); ×63 oil immersion lens. The quantification graphs show scatterplots of the white dots, depicting red (tubulin) or blue (DAPI) + green (ADNP) turned into white pixel intensities of the image shown in the adjacent pictures. (C) Quantitative analysis of ADNP–DAPI co-localization. (D) Quantitative analysis of ADNP-tubulin co-localization. (E) Quantitative analysis of ADNP–DAPI/ADNP-tubulin ratio of staining-based co-localization is represented, * p < 0.05. Nine fields were analyzed for each condition. A field is defined as one image by the confocal microscope (one image size = 1024 × 1024 pixels). Apparently, the majority of ADNP did not associate with microtubules or DNA (DAPI, D,E), possibly reflecting the multiple protein interaction sites on the protein (Figure 1C).

