Figure 4.
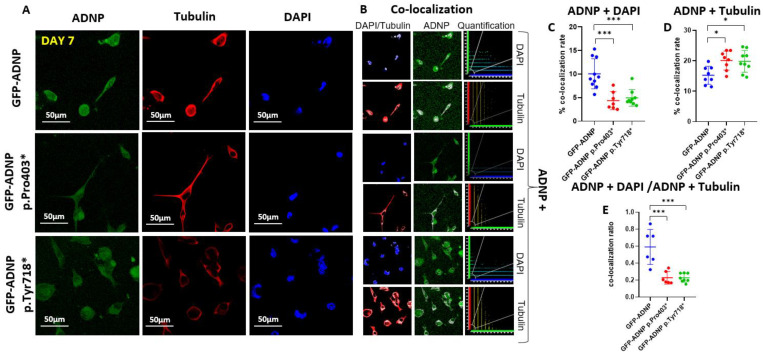
Immunostaining of tubulin and staining with DAPI in differentiated neuroblastoma-like neuronal cells (day 7 in culture) indicated an increased cytoplasmic localization of the ADNP mutants. (A) Neuroblastoma cell lines expressing full-length ADNP or truncated ADNP proteins conjugated to GFP (green) were immunostained with anti-tubulin (red) monoclonal antibodies (TUB2.1), while cell nuclei were stained/visualized with DAPI (blue). (B) Nuclear or cytoplasmic co-localization of the DAPI and ADNP or tubulin and ADNP, respectively, is represented by the white color; ×63 oil immersion lens. For further explanations, please see Figure 3B. (C) Quantitative analysis of ADNP–DAPI co-localization. (D) Quantitative analysis of ADNP-tubulin co-localization. (E) Quantitative analysis of the ADNP–DAPI/ADNP-tubulin ratio, reflected by merged staining upon co-localization is presented. Nine images were quantified, as described in the legend to Figure 3. Apparently, the majority of ADNP did not associate with microtubules or DNA, possibly reflecting the multiple protein interaction sites on the protein (Figure 1C). Asterisks denote: * p < 0.05; *** p < 0.001.

