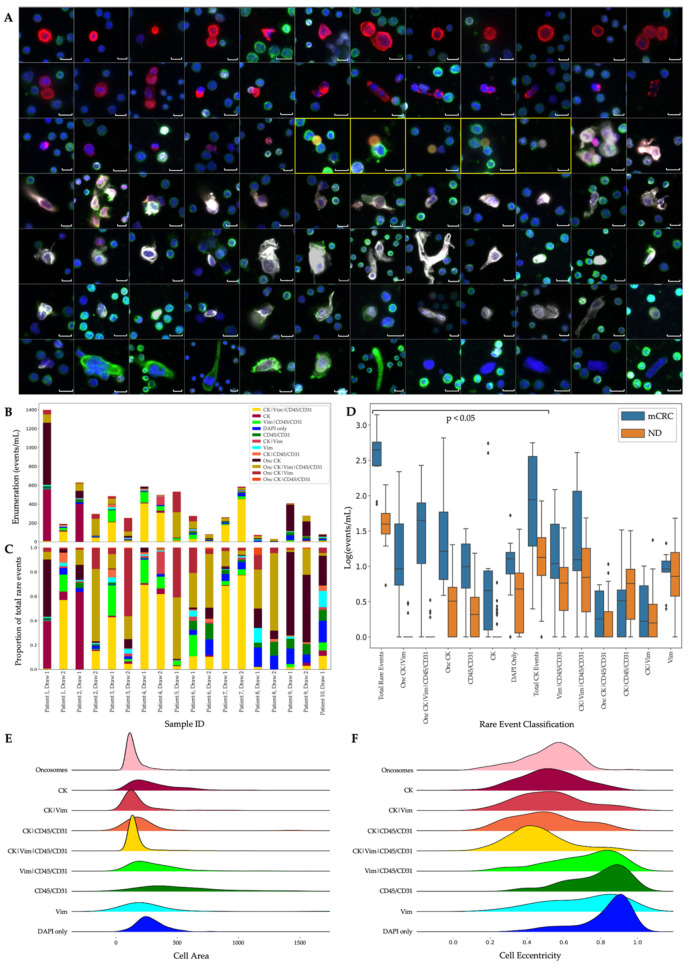
Figure 1.
Landscape-stained samples analyzed by OCULAR. (A) Representative gallery from the metastatic colorectal cancer (mCRC) cohort showing the morphological heterogeneity of the detected rare events. DAPI: blue, cytokeratin (CK): red, Vim: white, CD45/CD31: green. Events from each of the 10 patients are represented in the gallery. The five oncosomes displayed are bordered by yellow boxes. Events are ordered by decreasing CK signal intensity. Images taken at 400× magnification. Scale bars represent 10 µm. (B) Rare-event enumeration (events/mL) and (C) frequency (%) per patient and draw. (D) Enumeration comparison of Draw 1 mCRC and normal donor samples ordered by statistical significance. Symbols indicate outliers. The first 8 classifications from the left are different between mCRC and normal donors (p < 0.05). (E) Cellular area and (F) cellular eccentricity per rare-event classification detected in the mCRC cohort.

