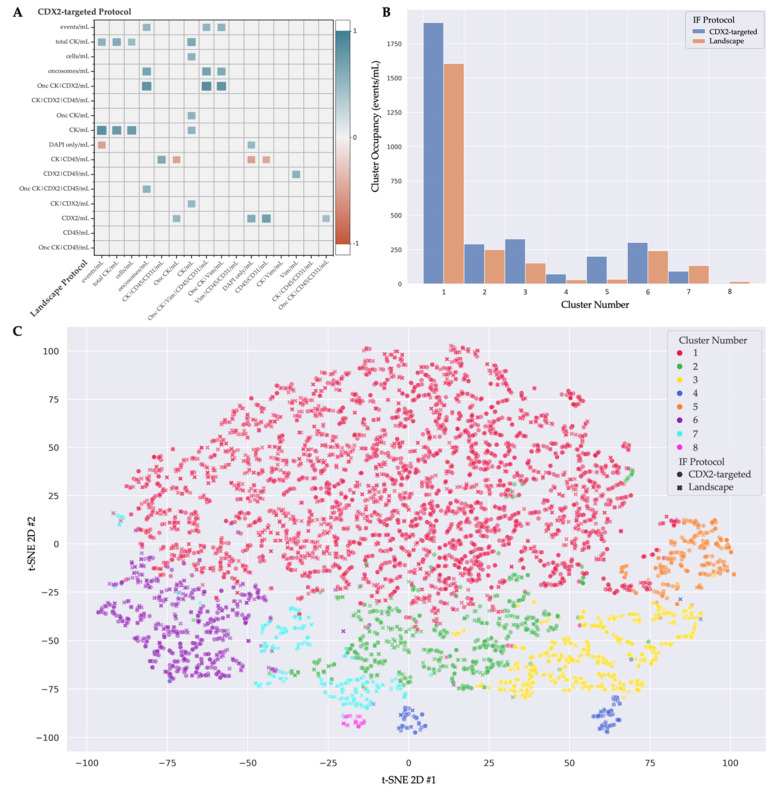
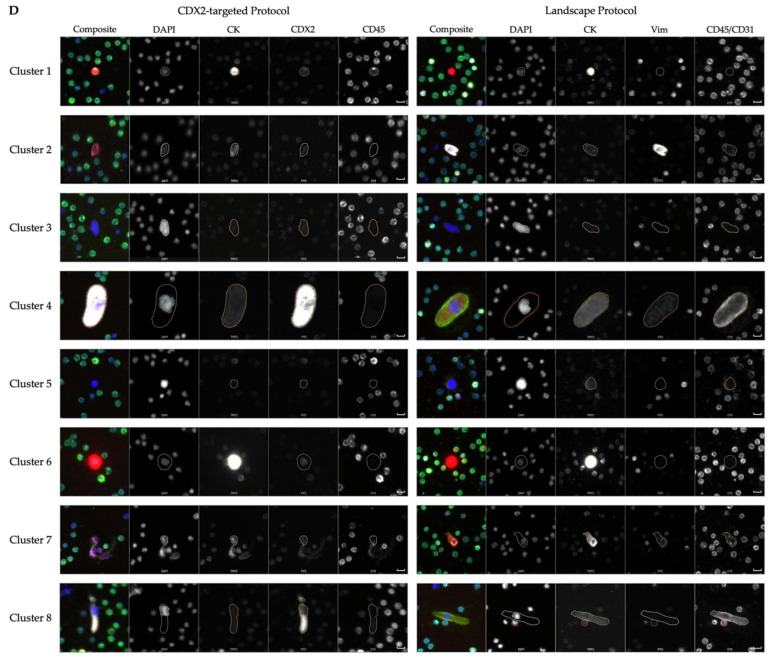
Figure 4.
Multi-assay analysis of the Landscape and CDX2-targeted immunofluorescence (IF) assays analyzed by OCULAR. (A) Statistically significant (p ≤ 0.05) rare-event-count correlations across the two IF assays, with the red-to-blue color gradient indicating a negative-to-positive correlation, respectively. (B) Cluster occupancy of the rare cells identified by the CDX2-targeted and Landscape stains when using the 8-group hierarchical clustering model. (C) t-Stochastic neighbor embedding (t-SNE) plot of the 8 cell clusters comprised of rare cells from both stains, as indicated by the markers’ shape. (D) Representative gallery of the 8 clusters with cells from both assays. Each row represents a cluster with a cell from the CDX2-targeted protocol on the left and a cell from the Landscape protocol on the right. Images taken at 100× magnification. Scale bars represent 100 µm.


