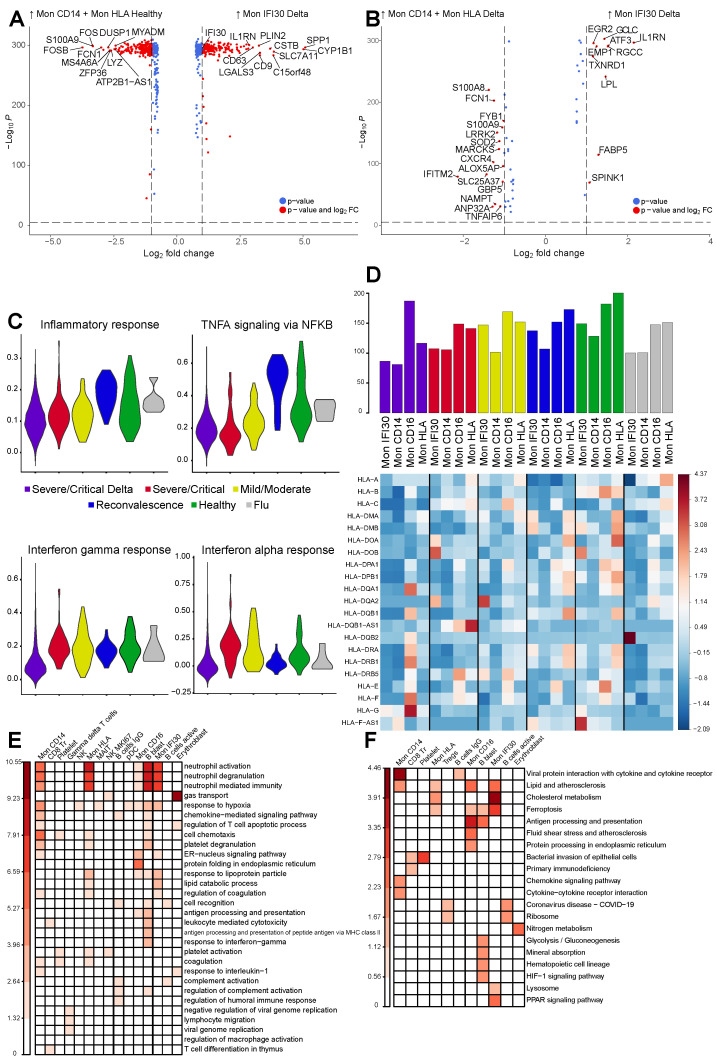
Figure 3.
(A) Volcano plot showing gene expression changes between Mon IFI30 from severe Delta samples contrasted with Mon CD14 and Mon HLA from healthy groups because Mon IFI30 is enriched only in the severe Delta COVID-19. Only top significant markers with absolute logFC > 0.75 are highlighted. (B) Volcano plot showing gene expression aspects specific for Mon IFI30 contrasted with Mon CD14 and Mon HLA inside Delta samples and indicating gene activity heterogeneity in the myeloid PBMC group due to severe Delta COVID-19. Only top significant markers with absolute logFC > 0.75 are highlighted. (C) Violin plot with module scores for Inflammatory, TNF alpha, Interferon-gamma, and Interferon-alpha signatures for Mon IFI30 cells across study groups. (D) Heatmap with expression (z-score) of the HLA genes in monocytes across study groups. Bar plot with the summed expression of the HLA genes within a cell type in each cohorte. (E) Heatmap with enrichment of the Biological Processes and (F) KEGG pathways enriched in a set of upregulated (p.adj < 0.05, logFC > 1.5) genes obtained in a pairwise cell subtype comparison between severe Delta and Wuhan-like samples.

