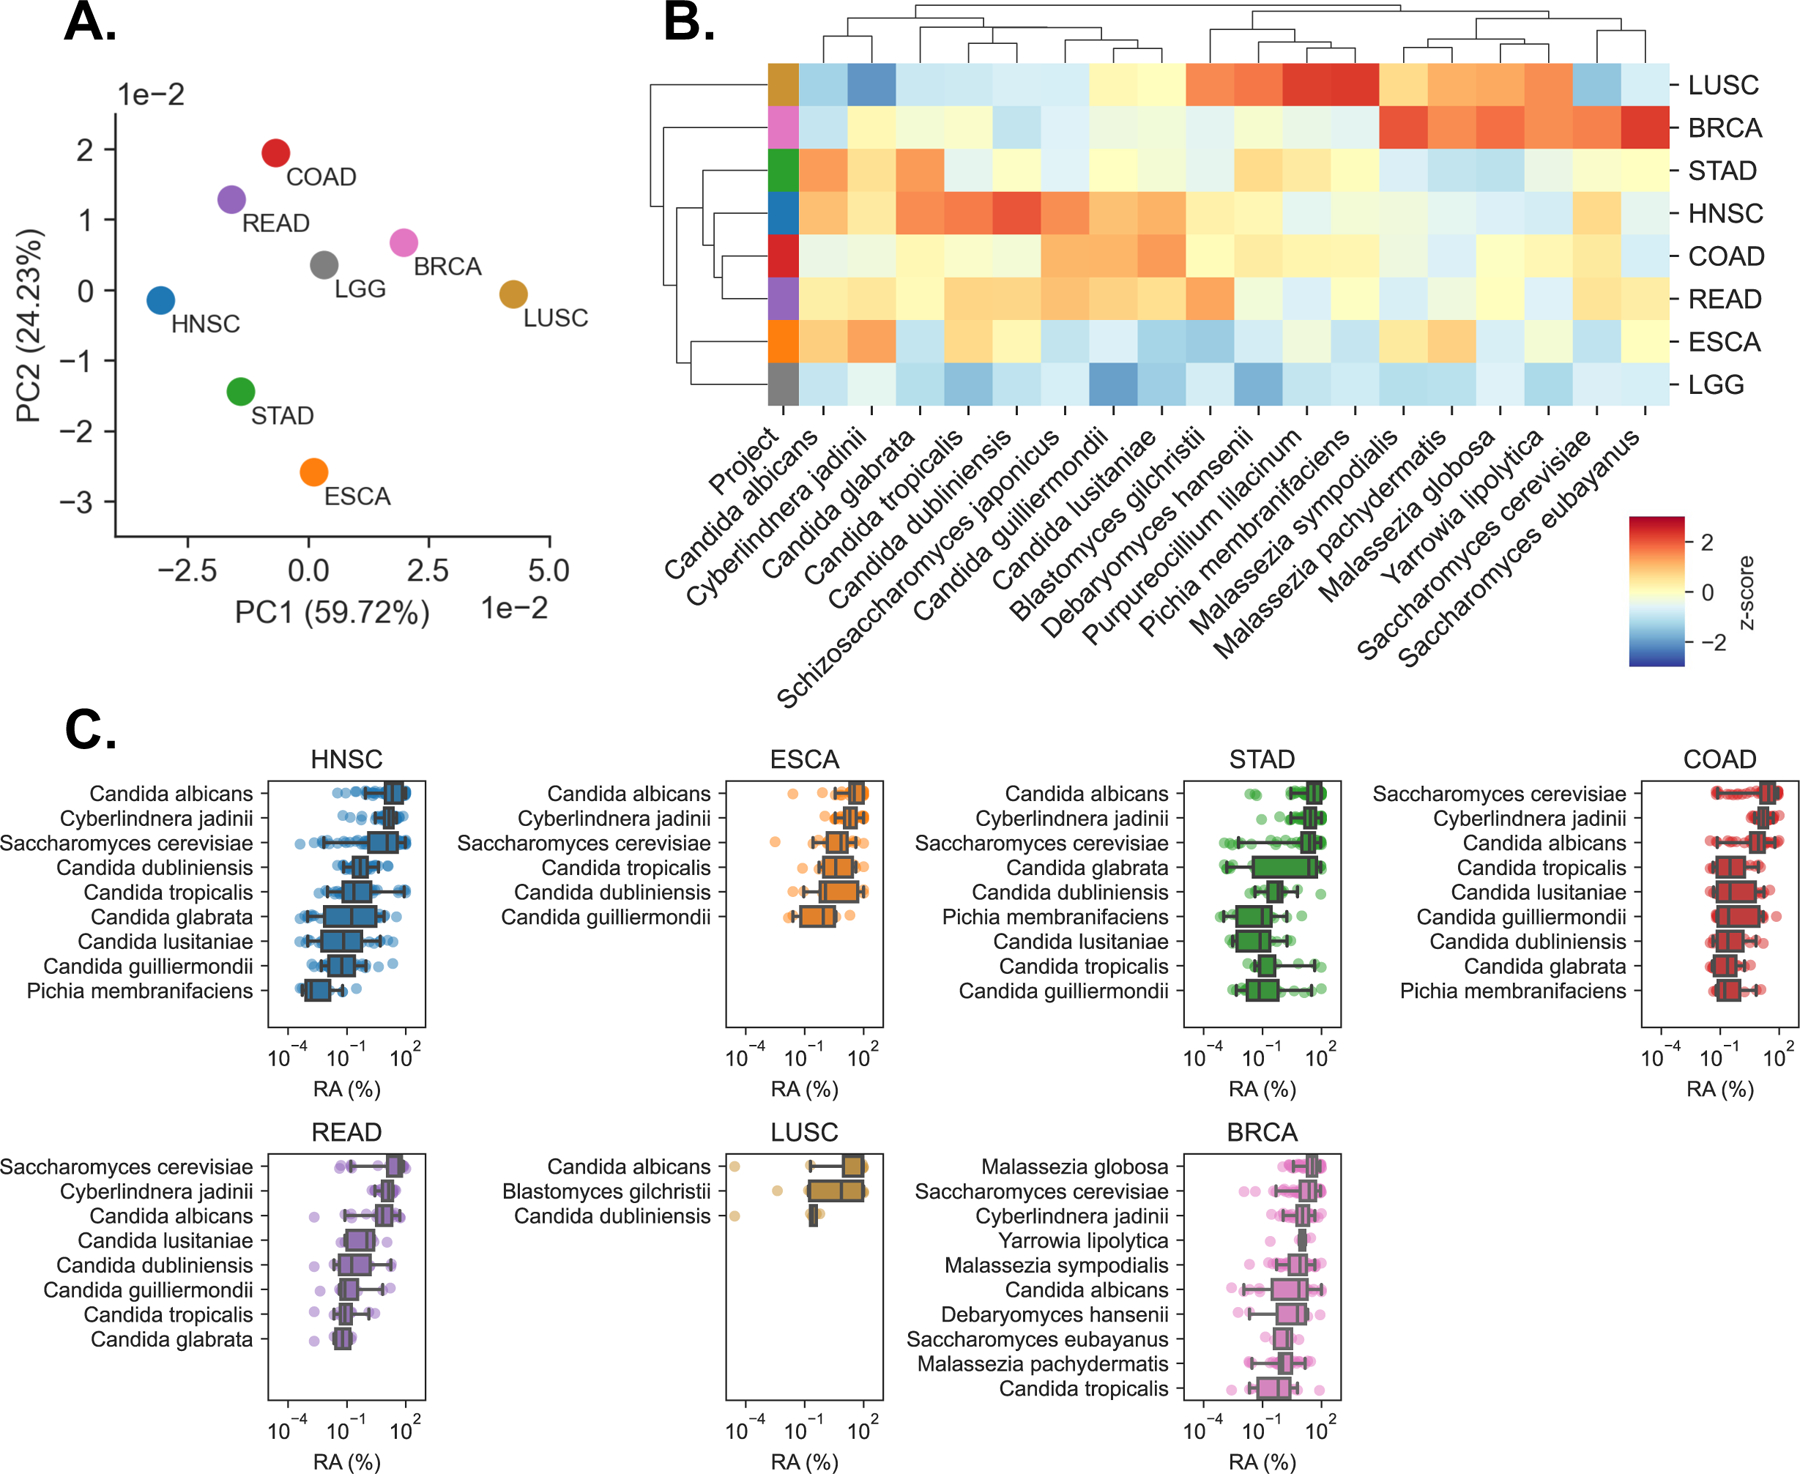
Figure 2. Primary tumor samples harbor disease-specific mycobiomes, See also Figure S2.

(A) Principal coordinate analysis (PCoA) of normalized species abundances from head-neck (HNSC), esophageal (ESCA), stomach (STAD), colon (COAD), rectal (READ), lung (LUSC), breast (BRCA), and brain (LGG) reveal clustering by tumor type, after filtering contaminants and false-positive signals.
(B) Clustered heatmap showing difference in relative fungal species abundances (RPM) between tissues from each TCGA cancer type, after filtering. Species are included if classified as tissue-associated in any of GI, lung, or breast samples, even if they were classified as contaminants in others. Heatmap values are z-scored by species abundance to highlight tissue-specific differences.
(C) Boxplots showing distribution of relative abundances (RA) from the 10 or fewer most abundant species detected in each cancer type, after removing low-prevalence and contaminant species.
