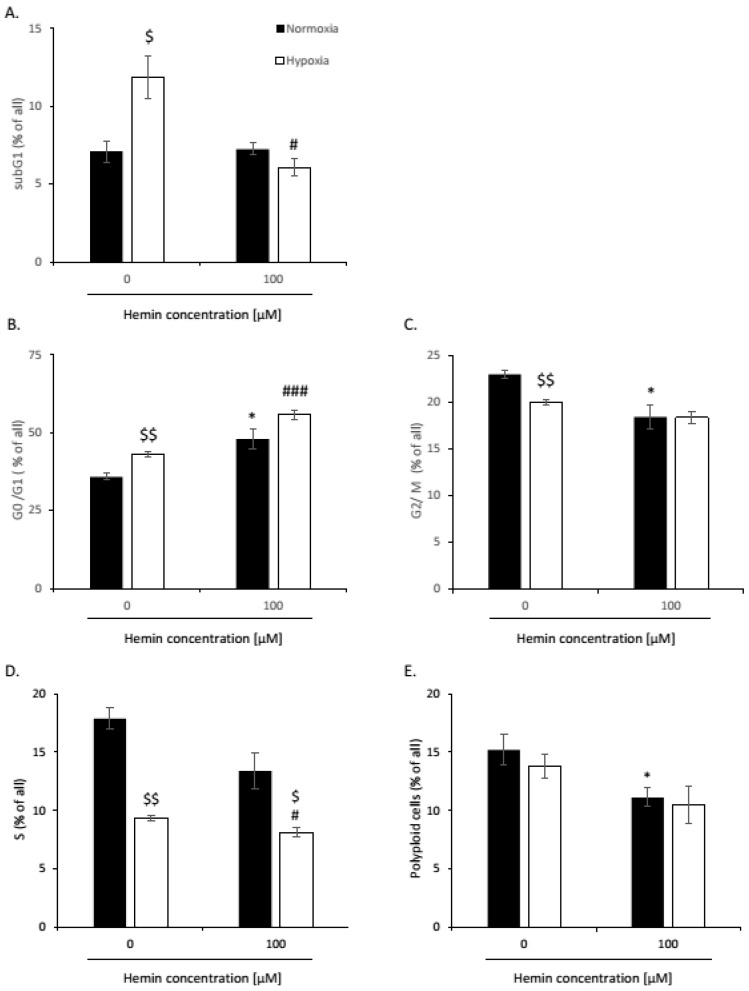
Figure A13.
High hemin concentration correlates with an escape from senescence of hypoxic SW480 cells: changed accumulation in different phases of the cell cycle. Quantification of the percentage of cells in the subG1 (A), G0/G1 (B), G2/M (C), and S phases (D), and polyploid cells (E). Cell cycle analysis was performed with the Cell Cycle Analysis Kit (Sigma) and flow cytometry; Each bar represents mean ± SEM, n ≥ 3; * p < 0.05—vs. control normoxia; # p < 0.05, ### p < 0.001—vs. control hypoxia; $ p < 0.05, $$ p < 0.01—normoxia vs. hypoxia.

