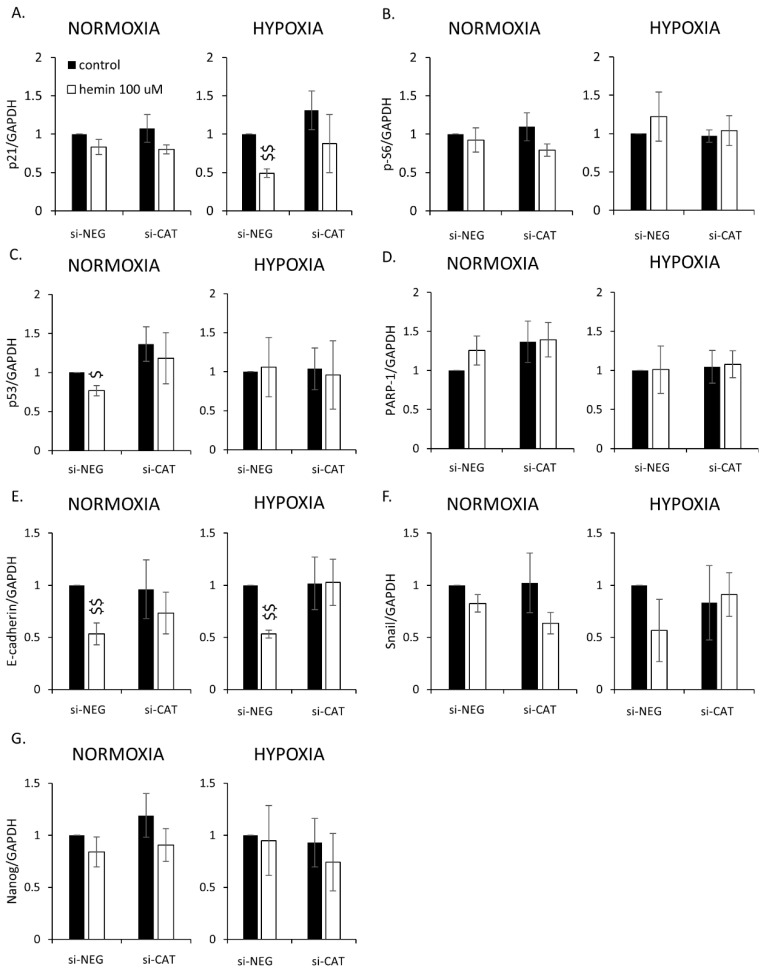
Figure A9.
Evaluation of the protein expression in HCT116 cells, where gene encoding CAT was silenced with the use of siRNAs: cell cycle inhibition and EMT markers. Cells were cultured in parallel in normoxia or hypoxia. Cells were treated with 2.5 μM IRINO and exposed to 100 μM hemin. Control cells were subjected to IRINO and NaOH. Quantification is based on the densitometry analysis performed with the use of ImageJ software. Data are shown as the ratio of the protein amount to respective protein loading control l (GAPDH): (A) p21; (B) p-S6; (C) p53; (D) PARP-1; (E) E-cadherin; (F) Snail; (G) Nanog. Each bar represents mean ± SEM, n ≥ 3; $ p < 0.05, $$ p < 0.01—control vs. hemin 100 μM.

