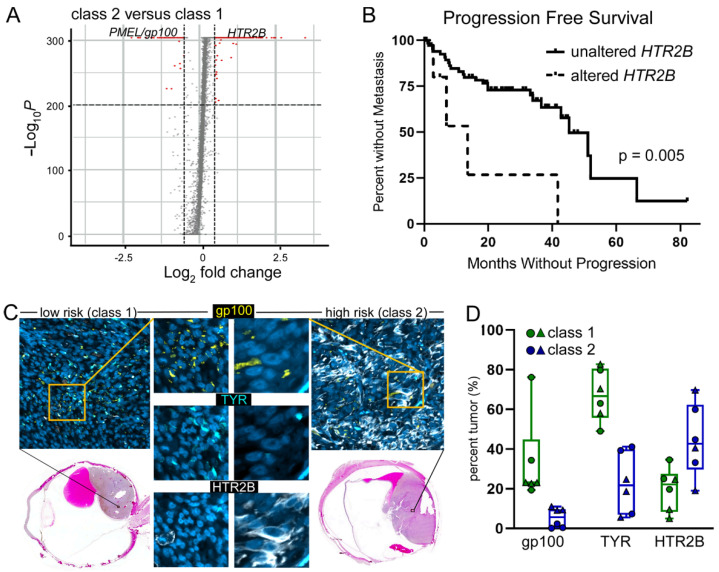
Figure 2.
Validation of gene elevated in high risk tumors. (A) Volcano plot of differential gene expression between class 2 and class 1 tumors from a publicly available single cell RNA-seq dataset. (B) TCGA uveal melanoma dataset of n = 79 patients analyzed for altered expression of HTR2B correlated with progression free survival. (C) low risk (class 1) and high risk (class 2) tumors stained with antibodies to gp100 (yellow), TYR (blue) and HTR2B (white) merged in the image. Individual antibody staining shown at higher magnification of the boxed region. Hematoxylin & eosin stained image of the same region of the globe is shown. (D) Quantification of protein staining from three regions of interest from each tumor.

