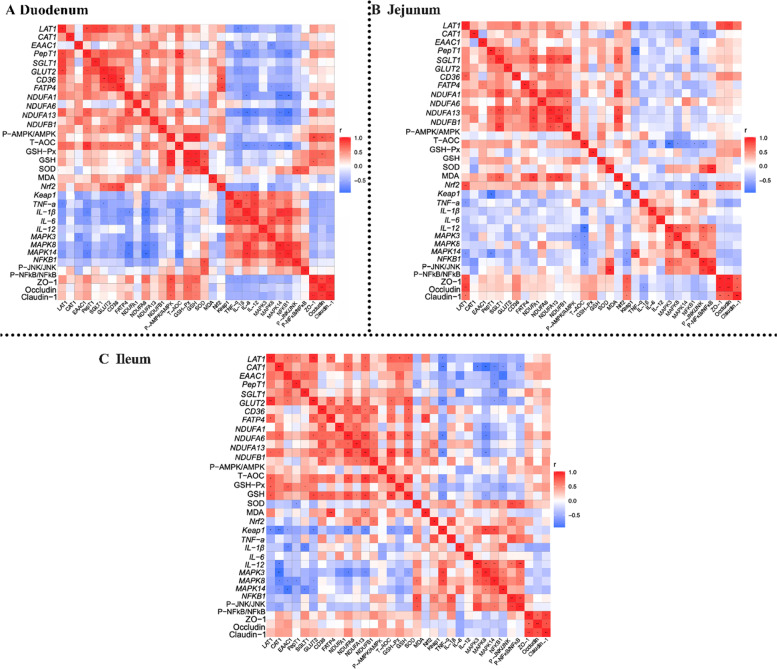
Fig. 12.
Heatmap of Pearson’s correlation coefficients between intestinal nutrition transport, energy metabolism, antioxidant status, immune status, inflammatory pathways and intestinal barrier function. A Heat map of duodenal correlation analysis. B Heat map of jejunal correlation analysis. C Heat map of ileal correlation analysis. In the panel, red with a P < 0.05 represents a significant positive correlation, blue with a P < 0.05 represents a significant negative correlation, and white represents no correlation. *P < 0.05; **P < 0.01

