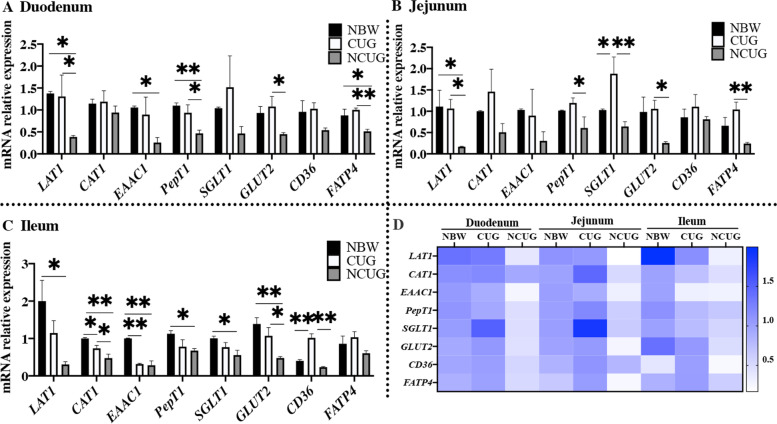
Fig. 3.
Intestinal nutrition transporters mRNA expression of NBW, CUG and NCUG piglets on 26 d. A The mRNA expression levels of LAT1, CAT1, EAAC1, PepT1, SGLT1, GLUT2, CD36 and FATP4 in the duodenum. B The mRNA expression levels of LAT1, CAT1, EAAC1, PepT1, SGLT1, GLUT2, CD36 and FATP4 in the jejunum. C The mRNA expression levels of LAT1, CAT1, EAAC1, PepT1, SGLT1, GLUT2, CD36 and FATP4 in the ileum. D Heat map comparison of mRNA expression levels of nutrition transporters in NBW, CUG and NCUG. Dates are presented as means ± SEM (n = 4). NBW, normal birth weight. CUG, catch-up growth. NCUG, not catch-up growth. *P < 0.05; **P < 0.01

