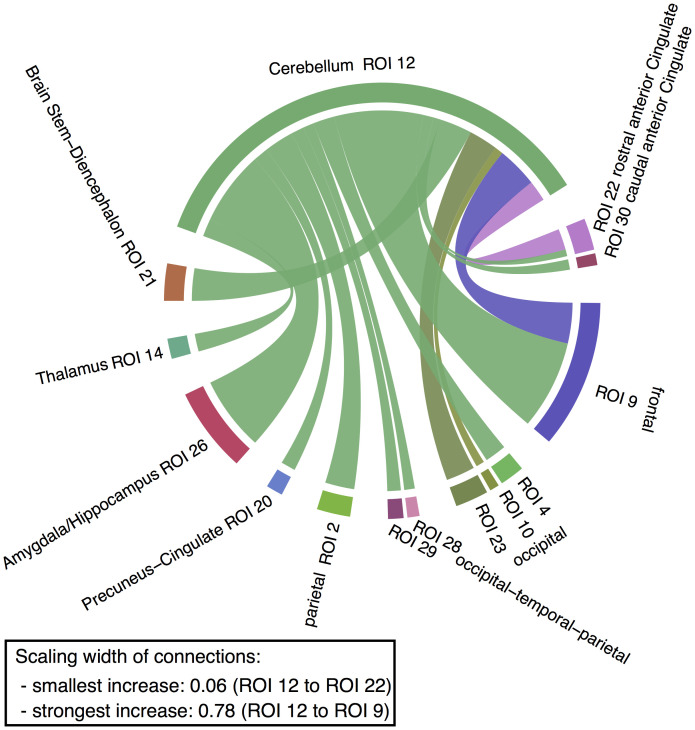
Fig. 2.
Increase in the strength of cerebellar connections during enhanced emotional memory encoding. Green edges indicate an increased connection from the cerebellum to a target ROI, while the other colors represent an increased connection from the ROI to the cerebellum. The width of the edges denotes the strength of the increase in connectivity in the replication sample. Only replicating connections are depicted (discovery sample nmax = 902, nmean = 887, nmin = 798; replication sample nmax = 433, nmean = 426, nmin = 378; posterior probability > 0.99; SI Appendix, Table S1). For a detailed breakdown of anatomical localization per ROI, see SI Appendix, Table S5. For connection strength values, see SI Appendix, Tables S6–S9. For additional illustrations, see SI Appendix, Figs. S8–S10.

