Fig. 1.
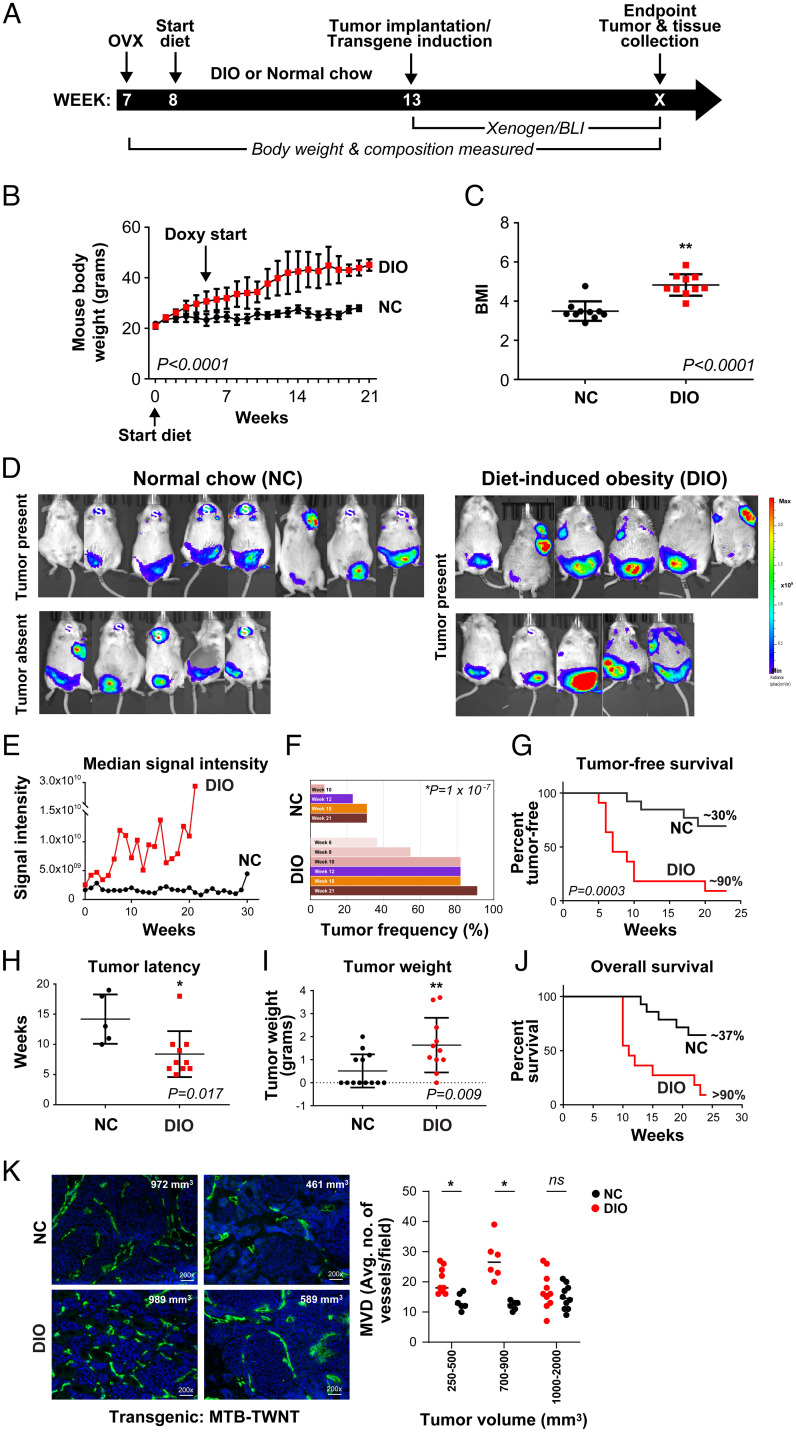
Obesity promotes tumor growth and angiogenesis in the MTB-TWNT breast tumor model. Timeline for tumor studies (A). Mice (FvB) on DIO versus NC diet gained significantly more body weight throughout the study (B; n = 21 per group; paired t test, P < 0.0001). BMIs of DIO mice were significantly higher than NC mice (C; week 21, n = 10 per group; Welch’s t test, **P < 0.0001). BLI signal in NC (n = 13) and DIO (n = 11) mice (D; EP study). All mice in the DIO group had tumors at EP; however, only 8/13 NC mice had tumors although BLI signal was present in all mice indicating expression of WNT (D). “S” depicts luciferase/WNT expression in salivary glands of MTB-TWNT mice; no tumors were detected in this area (D). Median signal intensity (EP study) was significantly higher in the DIO group (E; linear regression, unequal slopes, P = 0.0061). Tumor incidence (%) in DIO and NC groups (F). Tumor-free survival was lower in DIO mice (G; EP, median: DIO, 7 wk vs. NC, undefined, log-rank Mantel–Cox test, P = 0.0003). Tumor latency was shorter in DIO mice (H; median: DIO, 7 wk vs. NC, 13 wk, Student’s t test, *P = 0.017). Tumor burden was higher in the DIO mice (I; Student’s t test, **P = 0.009). Overall survival was lower in the DIO mice (J; EP, median: DIO, 11 wk vs. NC, undefined, Wilcoxon test, P = 0.008). MVD was higher in EP tumors from DIO mice. Representative CD31+ sections from DIO and NC tumors (K, Left; tumor sizes are indicated). MVD analysis in tumors stratified by size (K, Right; n = 2 or 3 per group; Student’s t test, *P < 0.05). ns, not significant. All error bars indicate mean ± SEM.

