Fig. 2.
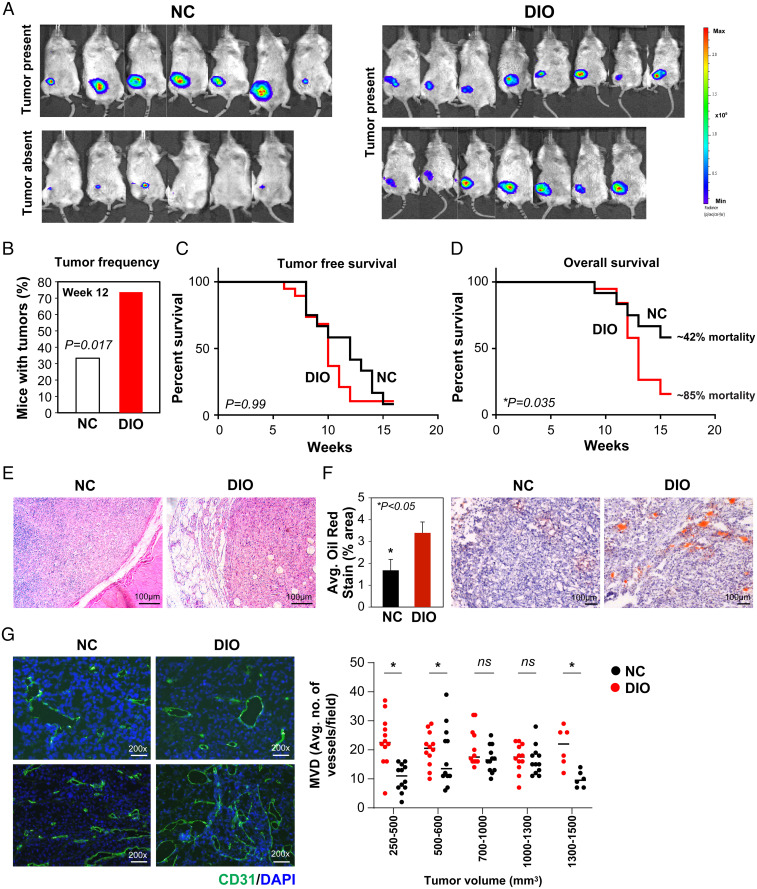
Obesity promotes tumor growth and angiogenesis in the xenograft MDA-MB-436P BC model. BLI signal in NC (n = 13) and DIO (n = 15) mice (A; EP). All mice in the DIO group had tumors at EP; however, only 7/13 NC mice had palpable tumors at EP (A). Tumor frequency was higher in DIO mice (B; Student’s t test, P = 0.017). Tumor-free survival at EP was not significantly different between the groups (C; log-rank Mantel–Cox test, median: DIO, 10 wk vs. NC, 12 wk, P = 0.99, ns). Overall survival was shorter in DIO compared with NC mice (D; log-rank Mantel–Cox test, median: DIO, 13 wk vs. NC, undefined, P = 0.035). Representative H&E of DIO and NC tumors (E). Increased Ad infiltration in DIO tumors (oil red staining) (F; *P < 0.05). Representative CD31+ sections from DIO and NC tumors (G, Left). MVD analysis in tumors stratified by size (G, Right; n = 2 or 3 per group; Student’s t test, *P < 0.05). All error bars indicate mean ± SEM.

