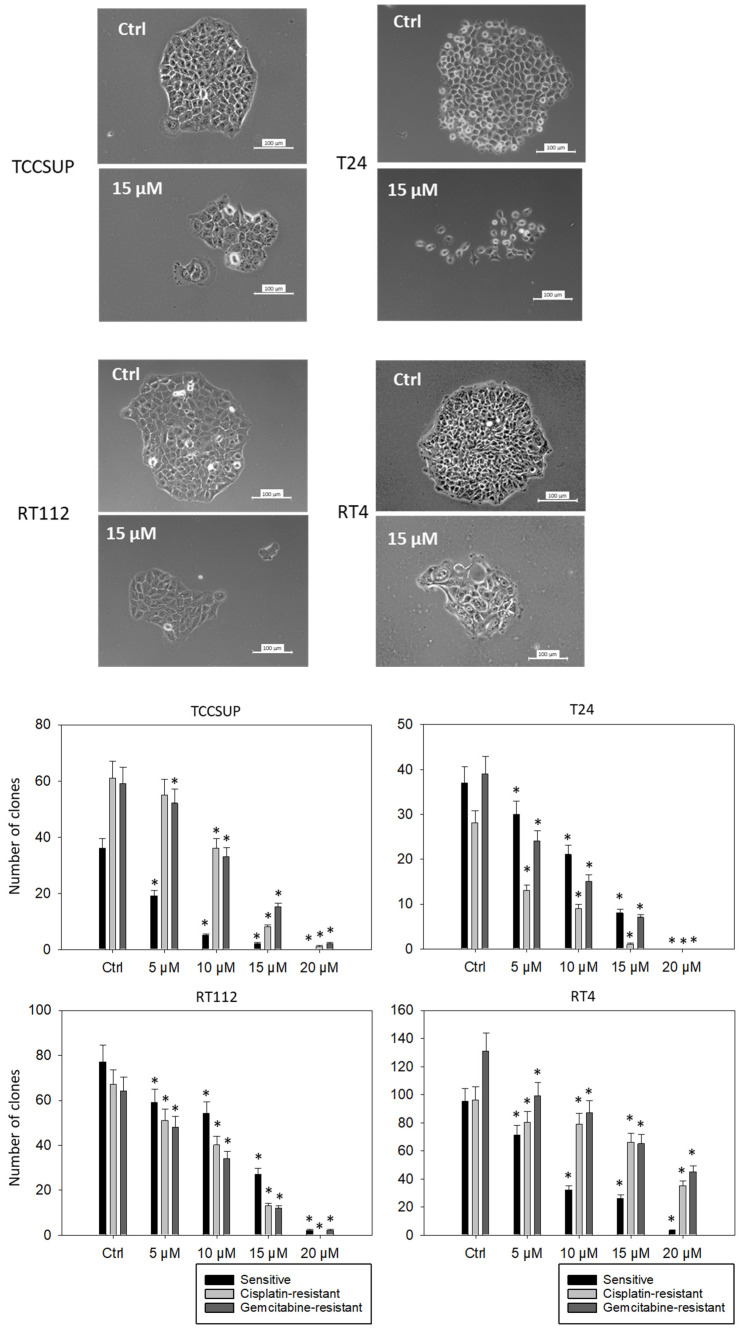
Figure 5.
Influence of SFN on the clone formation of sensitive TCCSUP, T24, RT112, and RT4 cells. Bar diagrams indicate clone counts in the presence of 5–20 µM SFN. Pictures of single tumor clones are related to the treatment of sensitive cells with 15 µM SFN. Controls (Ctrl) were without SFN, n = 3. * indicates a significant difference compared to untreated controls.

