Fig. 2.
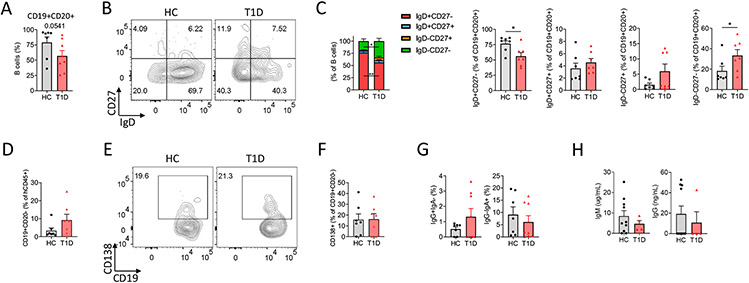
Characterization of B cell subsets in spleens of T1D and HC PI mice. (A) Frequency of total CD19+CD20+ B cells in HC (n = 7) and T1D (n = 8) PI mice from 2 independent experiments. (B) Representative staining and (C) aggregate summary of naïve CD27−IgD+, memoiy CD27+IgD−, unswitched CD27+IgD+ and unconventional memory CD27−IgD− B cells. (D) Frequency of CD19+CD20− cells among total human CD45+ cells. (E) Representative staining and (F) analysis of CD138+CD19+CD20− plasma cell frequencies. (G) Frequencies of IgG+IgA− and IgG−IgA+ B cells are shown. (H) Serum IgM and IgG levels in HC (n = 10) and T1D (n = 4) PI mice. Nonparametric Mann-Whitney test was used to calculate *P < .05 and **P < .005 (statistically significant). Data are represented as mean ± SEM.

