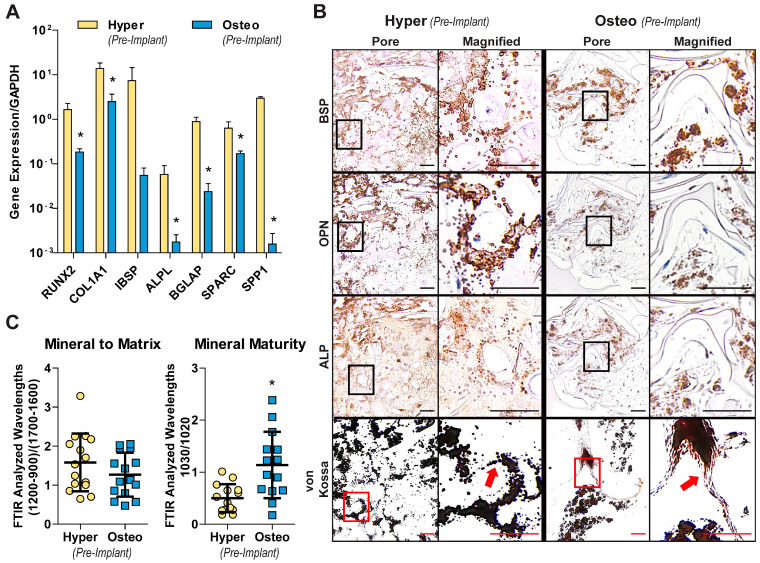
Figure 2.
Differentiated cells’ behavior and matrix deposition. (A) Expression of the key genes involved in bone development in hypertrophic chondrocyte and osteoblast constructs. The expression levels were normalized to GAPDH (n = 4). (B) Histology and immunohistochemistry at the scaffold pore level and cellular level (magnified images). Representative images are shown for von Kossa, BSP, OPN and ALP staining to demonstrate the differences in the deposition patterns. Red arrows point to the differences in the mineral’s appearance, with the hyper constructs containing globular mineral deposits and the osteo constructs depositing mineral along the scaffolds’ surfaces. Scale bars: 50 µm. (C) Mineral composition within the newly formed bone matrix, as determined by FTIR analysis of the mineral–matrix ratio and the maturity of the mineral (n = 16). Data (A,C) are shown as the average ± SD. * significant differences between the groups (p < 0.05).

