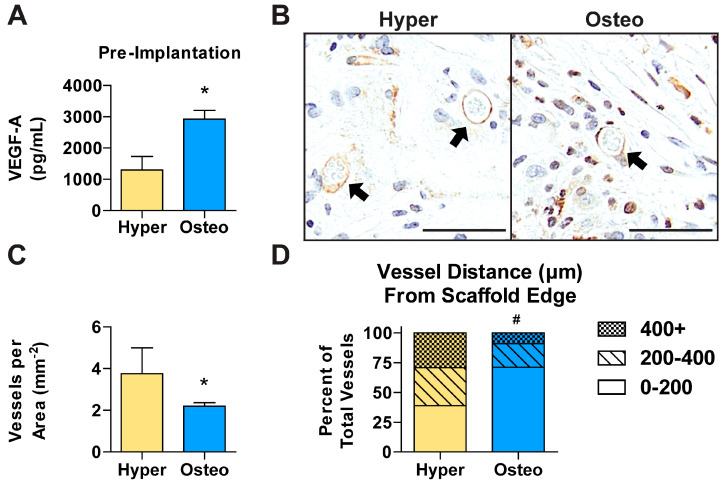
Figure 6.
Vascularization of the constructs. (A) The concentration of VEGF-A was determined in the culture media of both the hyper and osteo constructs. (B) CD31 immunohistochemistry at 6 weeks demonstrated the presence of vessels (black arrows) within the constructs. (C) Semi-quantitative analysis of CD31+ vessels per construct area. (D) Histogram showing the distance of the vessels from the nearest scaffold edge, grouped into three distance ranges: 0–200 µm, 200–400 µm and above 400 µm. Scale bars: 50 µm. All data (n = 4) are shown as the average ± SD. * Significant differences between the groups (p < 0.05), # Significant differences in the distribution of the vessels’ distances from the nearest scaffold edge (p < 0.05).

