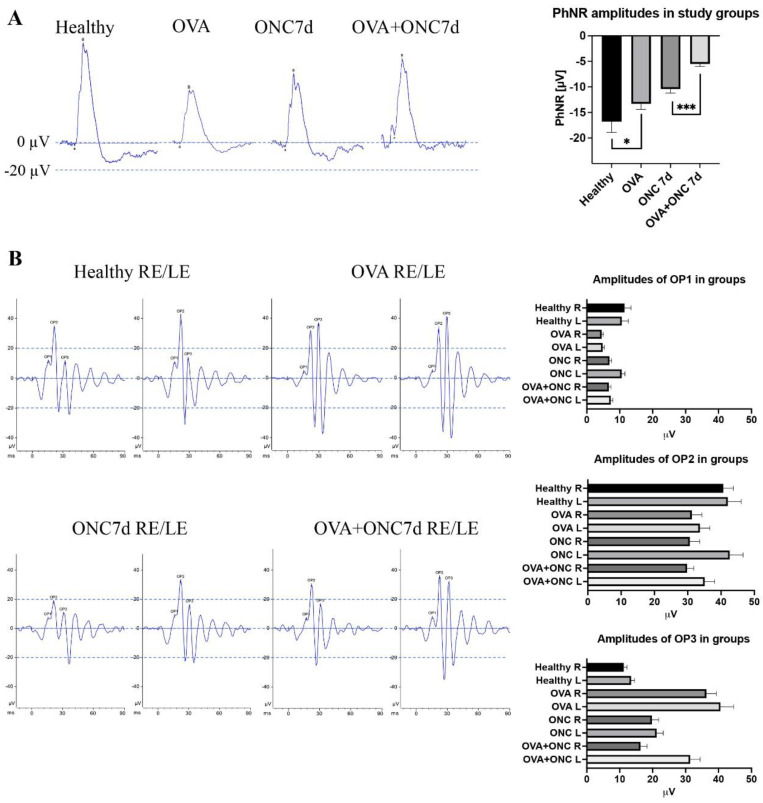
Figure 4.
Functional measurements in animal groups using ERG. (A) Photopic negative responses (PhNR) in experimental groups, including statistical analysis of PhNR amplitudes, *: p < 0.03, ***: p < 0.001; Welch’s t test. (B) Oscillatory potentials (OP) in experimental groups including descriptive statistics for OP1, OP2 and OP3. RE: right eye, LE: left eye.

