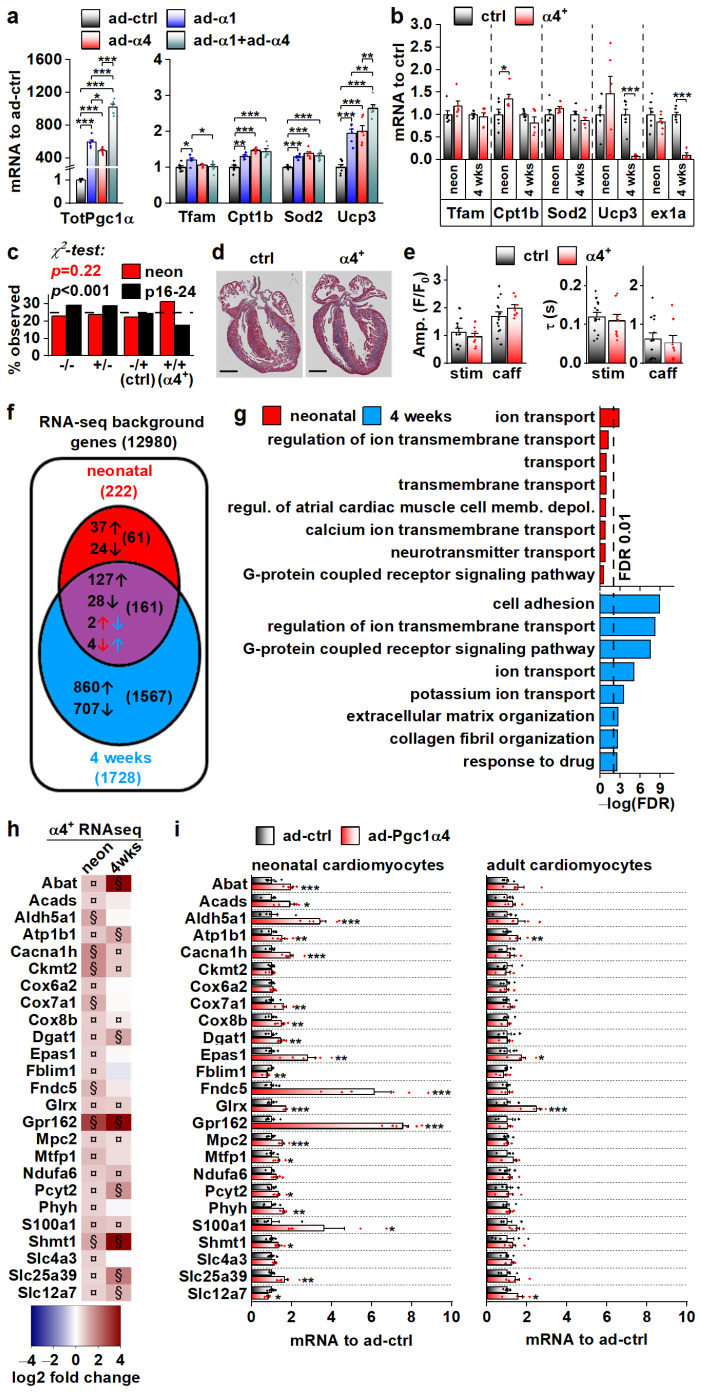
Figure 4.
PGC-1α4-induced Gene Expression Response and the Resulting Phenotype Depend on Cardiomyocyte Developmental Stage. (a) Expression of total Pgc-1α and known PGC-1α1 target genes in cultured adult cardiomyocytes transduced with adenoviruses expressing Pgc-1α1 and Pgc-1α4 (n = 6). (b) Expression of known PGC-1α1 target genes and exon 1a (ex1a) containing Pgc-1α transcripts in the ventricles of neonatal (neon, n[ctrl] = 6, n[α4+] = 6) and 4-week-old (n[ctrl] = 7, n[α4+] = 5) Pgc-1α4-overexpressing mice (α4+). (c) Ratios of live mice with different combinations Myh6-Cre/Flox-Pgc-1α4 transgenes 1–2 days (neon) and 16–24 days after birth (n[neon] = 215, n[p16–24] = 577). (d) MTC staining of longitudinal cardiac cross-sections from one-day-old control (ctrl) and α4+ heart (scale 1 mm). (e) Amplitudes (left) and decay times (right) of the stimulation-evoked (stim) and caffeine pulse (caff) calcium transients in cultured neonatal cardiomyocytes (n[ctrl] = 2/14, n[α4+] = 2/8). Blue and orange lines represent mean and distribution of the data. (f) Gene expression changes in ventricles of neonatal and 4-week-old Pgc-1α4 overexpressing (α4+) mice (n = 4) as assessed with RNA sequencing. Genes with absolute logarithmic fold change above 1 and adjusted p-value below 0.01 are considered differentially expressed. (g) Top eight enriched biological processes (gene ontology) among the differentially expressed genes in neonatal and 4-week-old α4+ ventricles. (h) Heatmap showing log2 fold change in comparison to age-matched control in selection of genes induced in neonatal α4+ ventricles in neonatal and 4-week-old α4+ ventricles (n = 4). Note that genes with absolute log2 fold change below 1 were not included in enrichment analyses in panels f and g. (i) Gene expression in selection of genes induced in neonatal α4+ ventricles in cultured neonatal and adult cardiomyocytes transduced with PGC-1α4 adenovirus (n[adeno neon] = 5–6, n[adeno adult] = 4–5). Student’s t-test p-value (or Bonferroni post hoc test p-value for one-way ANOVA in panel a or hierarchical test p-value in panel e): *, p < 0.05; **, p < 0.01; ***, p < 0.001. Heatmap: §, DESeq2 analysis p-value p < 0.01 and absolute log2 fold change > 1; ¤, DESeq2 analysis p-value p < 0.01 and absolute log2 fold change < 1.

