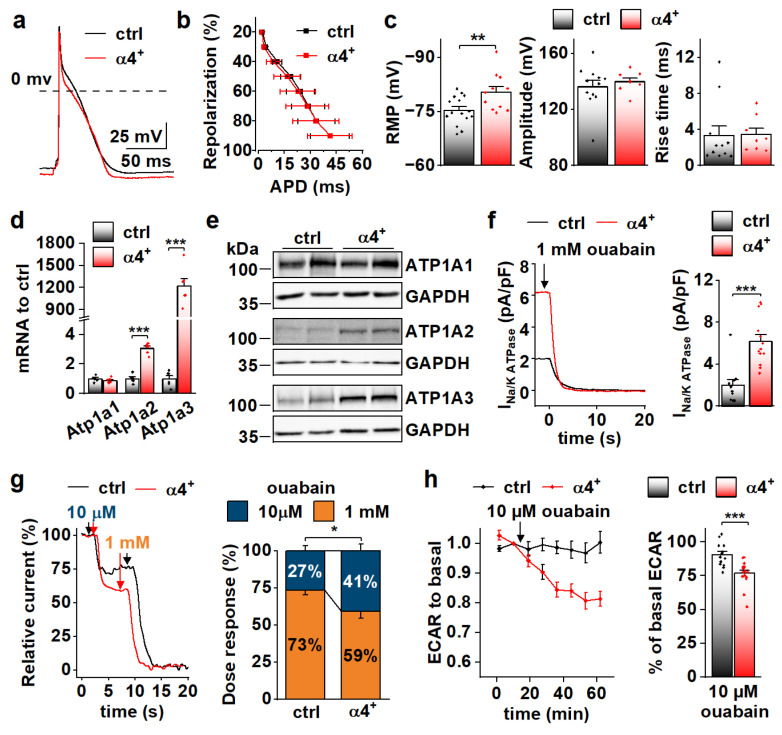
Figure 5.
PGC-1α4 Overexpression Induces Na-K ATPase Expression and Leads to a Drastic Increase in Its Current in Neonatal Cardiomyocytes. (a) Representative action potentials from cultured neonatal cardiomyocytes. (b) Action potential duration (APD) plotted against repolarization phase. (c) Resting membrane potential (RMP, left, n[ctrl] = 4/15 (animals/cells), n[α4+] = 3/11), amplitude (middle, n[ctrl] = 4/12, n[α4+] = 3/8) and rise time (right, n[ctrl] = 4/11, n[α4+] = 3/8) of the action potentials. (d) mRNA expression of sodium–potassium ATPase isoforms α1 (Atp1a1), α2 (Atp1a2) and α3 (Atp1a3) in ventricles of neonatal control (ctrl) and Pgc-1α4 overexpressing (α4+) (n = 6). (e) Protein expression of sodium–potassium ATPase isoforms in neonatal ventricles. (f) Representative Na+/K+ ATPase current traces under application of a saturating concentration of ouabain (left) and statistics of the ouabain sensitive current (right) in isolated neonatal cardiomyocytes (n[ctrl] = 3/11, n[α4+] = 2/13). (g) Representative relative Na+/K+ ATPase current traces under consecutive applications of 10 µM and 1 mM ouabain (left) and statistics of relative proportion of the current sensitive to 10 µM ouabain (right) in neonatal cardiomyocytes (n[ctrl] = 1/7, n[α4+] = 1/10). (h) Changes in glycolytic rate of isolated neonatal cardiomyocytes induced application of 10 µM ouabain (n[ctrl] = 3/14 (animals/wells), n[α4+] = 3/17). p-value from hierarchical statistical test (or Student’s t-test in panel d): *, p < 0.05; **, p < 0.01; ***, p < 0.001.

