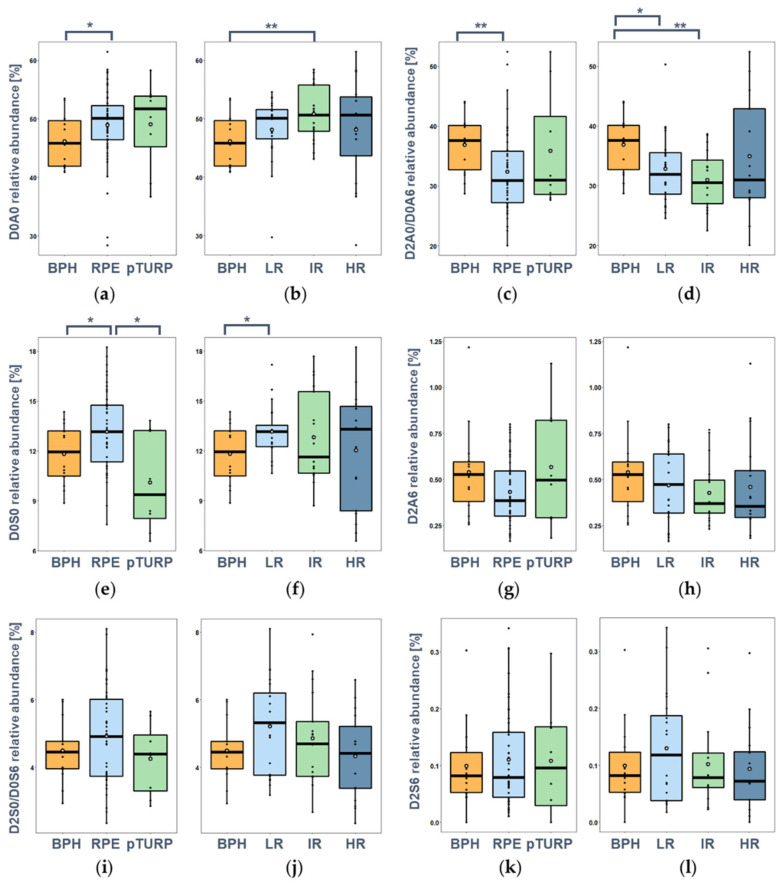
Figure 5.
Relative abundance of measured HS disaccharides as a function of the surgery type and the risk stratification based on Gleason scores, respectively: (a,b) D0A0; (c,d) D2A0/D0A6; (e,f) D0S0; (g,h) D2A6; (i,j) D2S0/D0S6; (k,l) D2S6. (*: p < 0.05, **: p < 0.01). See Figure 1 for resolving the GAG structure codes.

