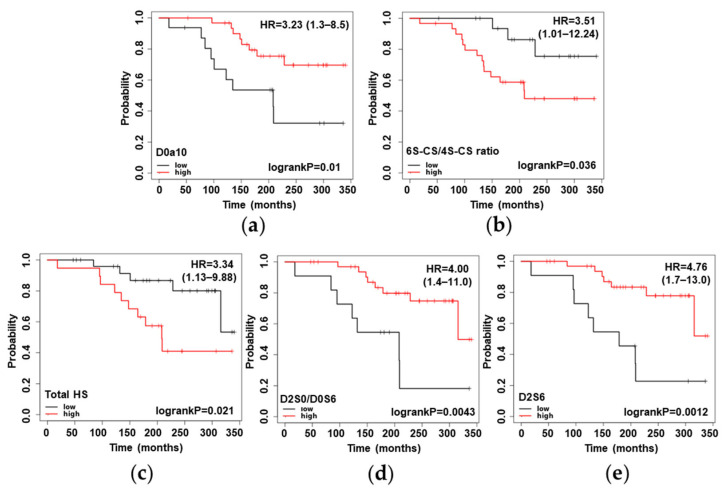
Figure 6.
Kaplan–Meier plots of radical prostatectomy patients, based on the level of a given GAG motif: (a) D0a10 relative abundance; (b) 6S-CS/4S-CS ratio; (c) total HS abundance; (d) D2S0/D0S6 relative abundance; (e) D2S6 relative abundance. Low- and high-value groups were not further corrected for the Gleason score and pathological stage data. See Figure 1 for resolving the GAG structure codes.

