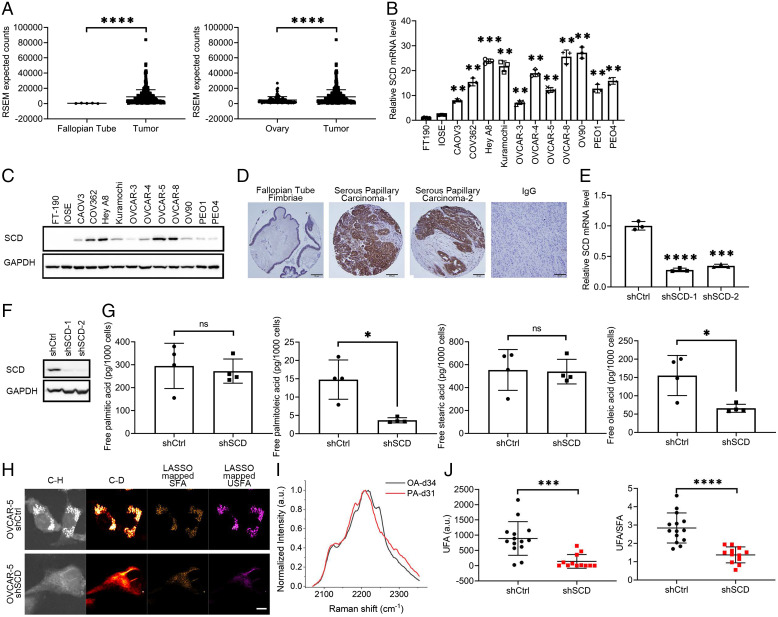
Fig. 1.
SCD is highly expressed in OC and is associated with increased levels of free UFAs. (A) SCD expression from RNA-seq data in (Left) fallopian tube and (Right) normal ovary tissue compared to OC tumors in patients from the UCSC Xena Browser. Expression is shown as RSEM expected counts. (B) Real-time qRT-PCR analysis of SCD expression (mean ± SD, n = 3) and (C) Western blot measurements of SCD protein levels in FT-190, IOSE, and 11 OC cell lines. (D) Representative images of IHC staining for SCD under 20× magnification in fallopian tube fimbriae (first panel) and HGSOC specimens (second and third panels). Negative control (IgG) is shown in the fourth panel (tumor tissue). (Scale bar, 50 μm.) (E) SCD expression measured by qRT-PCR (mean ± SD, n = 3) in OVCAR-5 cells transduced with shRNAs (1 or 2) targeting SCD (shSCD) or control shRNA (shCtrl). (F) Western blot of SCD in shCtrl and shSCD OVCAR-5 cells. (G) Lipidomics analysis of PA (16:0), palmitoleic acid (16:1), stearic acid (18:0), and OA (18:1) in shCtrl and shSCD OVCAR-5 cells cultured in medium containing low serum (1% FBS) for 48 h (means ± SD, n = 4). (H) Representative SRS images in C-H and C-D regions and LASSO mappings of SFA and UFAs (USFA) in shSCD vs. shCtrl OVCAR-5 cells treated with 12.5μM PA-d31 and cultured in low serum conditions. (Scale bar, 10 µm.) (I) Normalized SRS spectra of OA-d34 and PA-d31 (PA-d31) as reference spectra of UFA and SFA, respectively, for LASSO analysis. (J) Quantitative analysis of LASSO mapped USFA and ratio between USFA and SFA in shSCD vs. shCtrl OVCAR-5 cells. Each data point represents quantitative result from a single cell (n = 12 to 14). *P < 0.05, **P < 0.01, ***P < 0.001, ****P < 0.0001. ns, not significant.

