Fig. 5.
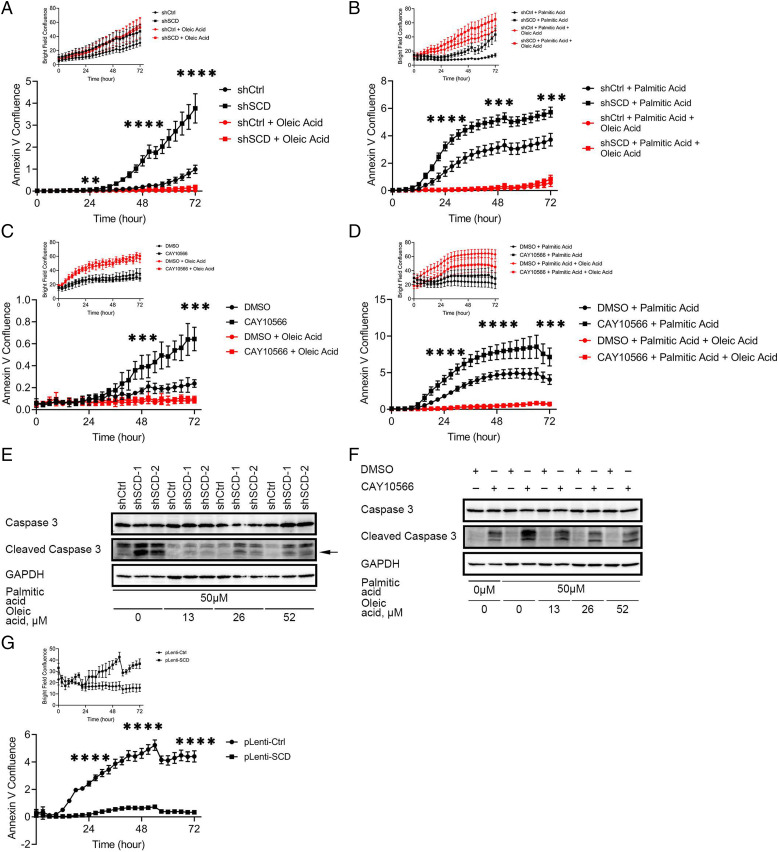
Apoptosis induced by SCD inhibition, or treatment with PA, is attenuated by exogenous OA or SCD overexpression. Time-lapse imaging of Annexin V staining (bright field signal as shown in Top) to measure apoptosis in OVCAR-5 cells transduced with control shRNA (shCtrl) or shRNA targeting SCD (shSCD), cultured in low-serum conditions, and treated (A) with 52μM OA or (B) with 50 μM PA alone or in combination with 52 μM OA. Time-lapse of Annexin V imaging (bright field signal as shown in Top) to measure apoptosis in OVCAR-5 cells cultured in low-serum conditions and treated (C) with 21.6 nM CAY10566, 52 μM OA or combination, or (D) with 8.1 nM CAY10566, 50 μM PA, 52 μM OA, or combinations. (E) Western blot of full-length and cleaved caspase-3 in shSCD vs. shCtrl cells cultured under low-serum medium and treated with 50 μM PA and indicated doses of OA for 12 h. Arrow indicates the band of interest. (F) Western blot of full-length and cleaved caspase-3 in OVCAR-5 cells cultured in low-serum medium and treated with 8.1 nM CAY10566, 50 μM PA, and indicated doses of OA for 12 h. (G) Time-lapse of Annexin V imaging (bright field signal as shown in Top) to determine apoptosis in OVCAR-5 cells overexpressing SCD (pLenti-SCD) and control cells (pLenti-Ctrl), cultured in medium containing low serum and treated with 50 μM PA. Values in A–D and G are means ± SD, n = 6. **P < 0.01, ***P < 0.001, ****P < 0.0001.

